That’s the concept behind Thriving, a yearlong reporting project we at Technical.ly are leading with support from the Pew Charitable Trusts, William Penn Foundation and the Knight Foundation. The focus: What do residents feel are the obstacles and opportunities for them to thrive economically? Our approach has been to gather the lived experiences of residents from cities across the country, while giving a special lens to Philadelphia — where the US and Technical.ly started.
To focus the project lessons, we chose 10 key demographic — or persona — groups to follow most closely. Could there have been more? Or fewer? Or different? Surely. Awash with economic data, the project is focused on people’s stories from hundreds of interviews, discussions and conversations. These demographic groups have sharpened our approach.
Now that the project is more than halfway completed, it felt overdue to share more about why we selected these 10 demographic groups. The people’s stories are most important, and you can find dozens of them here. This is a look at our process.
The project’s design phase was heavily data reliant. We built a model of what a statistically representative 100 residents might look like in several US cities, including Philadelphia, and we looked for themes. We reviewed an array of economic outlooks, especially for the Northeast and Midwest, and spoke to a dozen analysts, demographers and statisticians to pick up indicative trends. In particular, the Pew Charitable Trusts’ annual State of the City reports gave us an important foundation. All that gave us a few big priorities for the project: a diversity of Black perspectives; new Hispanic voices; a range of immigrant experiences; and stories from older workers, disabled workers and gig workers.
Here are the 10 persona groups we’re following most closely and why.
Recent Immigrants
Why? They represent a significant component of our future workforce.
Like most of the rich world, the native-born US workforce is aging. One big advantage the United States has is that, despite declines in recent years, it remains the world’s most desired destination for hopeful immigrants. In 2021, nearly 900 million people in the world wanted to migrate here if they could, and nearly 1 in 5 named the US as their top pick — more than double second-place Canada, according to Gallup.
Legal immigration to the US declined under the Trump administration, especially as the pandemic took hold, according to various analyses. Rates of both legal and illegal immigration have increased under the Biden administration. Politics set aside, a big part of the American growth story for the future will be shaped by immigration policy.
One note on terminology: In most government data, the term “immigrants” (which is often listed as the foreign-born population) refers to people living in the country who were not US citizens at birth. That includes naturalized citizens, lawful permanent residents, those on work or student visas, those admitted under refugee or asylee status and those without a legal status in the United States.
Older Immigrants
Why? They demonstrate how effectively our changing population can grow older where they live.
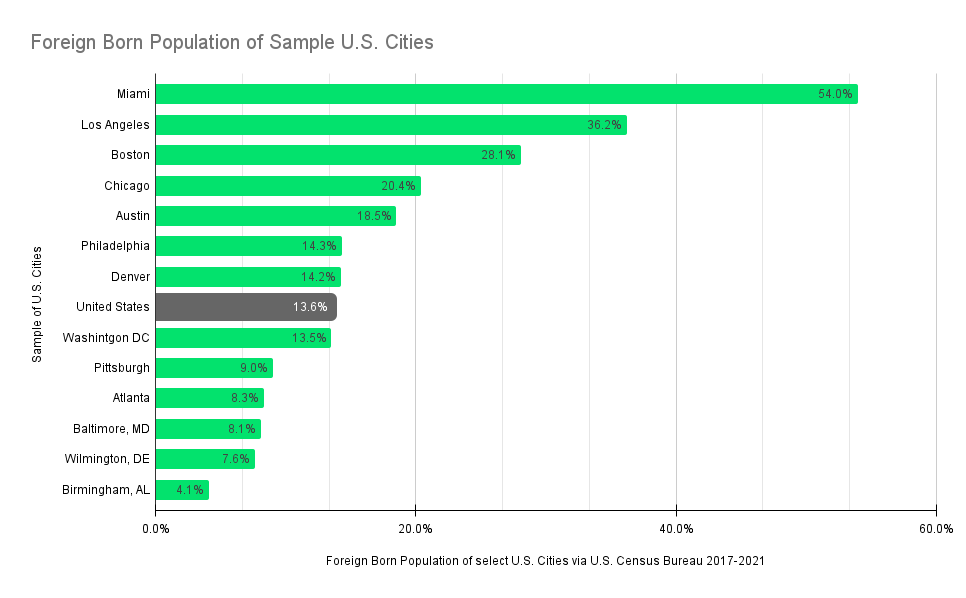
Roughly 14% of American residents are foreign-born, the highest share in more than a century. Immigrants, on average, are younger than their native-born peers, but as generations of past immigrants get older, they offer insight into how Americans age in place.
According to a Technical.ly analysis of 20 US cities, roughly three-quarters of older immigrants earn less than $35,000, as they live on fixed incomes or rely on family and friends.
Still, overall, higher concentrations of immigrants overall are predictive of growing cities. Miami and Los Angeles have the country’s highest big-city rates of immigrant residents. Other big cities with relatively high immigrant populations, including dynamic cities like Atlanta, Austin, Boston, Chicago, DC, Philadelphia and Seattle — much higher than cities with population declines like Detroit and Baltimore.
Immigrant Entrepreneurs
Why? They make outsized economic and cultural contributions to their communities.
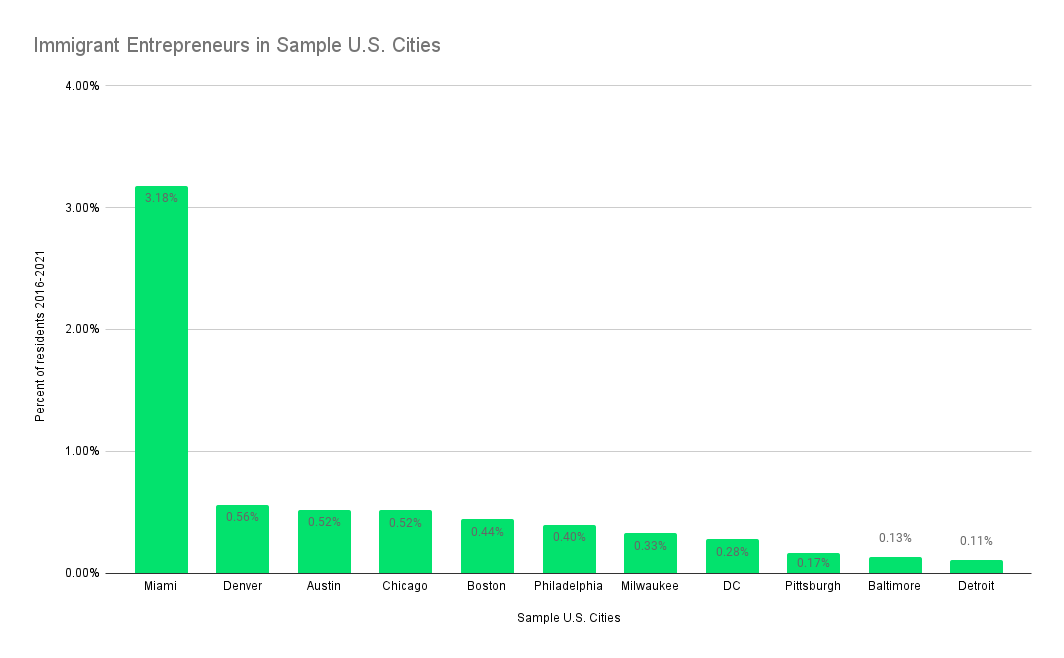
Immigrants to the United States are 80% more likely to start companies than their native-born peers, according to a 2022 analysis from an MIT economist. Their firms also tend to employ more people than those from non-immigrants. In 2019, immigrant entrepreneurs made up 21.7% of all U.S. business owners, despite comprising just 13.6% of the population and 17.1% of the workforce, according to the New American Economy, a pressure group.
Those businesses range from commercial corridor storefronts like restaurants and laundromats to high-tech software and gene therapy companies. They bring in new ideas and add dynamism to the American cultural identity. Given the crucial role that entrepreneurship plays for economic growth, they are vital to understand any city’s future.
According to a Technical.ly analysis of 20 US cities, it is common for between 20% and 35% of immigrant entrepreneurs to earn at least $100,000, meaning they are wealth builders.
Black Working Mothers
Why? They are crucial leaders in an effort to break generational poverty.
More than half of Black mothers are raising children on their own, according to the US Department of Labor.
Across 20 cities that Technical.ly analyzed, half of Black mothers with kids under 18 years of age report income of less than $35,000, but the figure varies widely across the country. In Atlanta, Austin, Baltimore, Boston, Los Angeles, Philadelphia and DC, less than half of Black working mothers live in poverty. In Chicago, Denver and Seattle it’s about half. In Pittsburgh, like Cleveland and Detroit, two-thirds do, and in Miami, the total is nearly three-quarters — the highest rate in our index.
Black working mothers are a vulnerable demographic with a considerable influence on how the next generation of Black families will grow.
Young Black Men
Why? They are a key demographic for economic and social change.
“No other demographic group has fared as badly, so persistently and for so long,” wrote the Brookings Institution. Disinvestment, racism and cultural factors leave young Black men one of the most vulnerable — and most important — categories of Americans.
At least three-quarters of young Black men living in nearly all of the 20 big US cities that Technical.ly analyzed lived in households reporting income of $35,000 or less. Rates of joblessness, violence, poverty, imprisonment and countless other social indicators of health make clear that we have fallen short in delivering on the promises of citizenship.
Yet, young Black men are also major sources of culture and creativity. They remain heavily underrepresented in complex narratives of our economic future.
Middle-Income Black Residents
Why? They can help us understand how to retain and share prosperity with more residents.
Middle class is a social construct. Researchers prefer “middle income,” a far more definable metric. For this project, we were interested in how residents self-identified. Still, we used an income guide: Median household income in Philadelphia is shy of $50,000, more than $20,000 off the national average. Median income for Black households is far lower, just $39,000 in Philadelphia and $46,400 nationally. In Baltimore, Black median income is half that of white median income.
In Philadelphia, declines in both the Black population and the Black poverty rate suggest that it is following a path already trod by Boston and New York, cities that pushed out poorer residents without sharing prosperity. That means middle-income Black households have especially important insight.
Black Professionals
Why? They show us how we can combat race-based income inequity and create opportunity.
The net wealth of the average white family is 10 times larger than that of the average Black family. Even when controlling for those who started from the same place in their 30s, older white Americans outearn their Black counterparts, according to Brookings research on wealth mobility. What to do about it? The Black-white wealth gap is recognized as a generations-long project, as the Center for American Progress has argued. One contributing way to make up ground is for a higher share of Black workers to earn more and faster.
Black professionals, especially those earning over a high-income threshold of $100,000, reflect where racial income and wealth gaps are most readily confronted. As Technical.ly found in our series Who Makes $200K, the income level for angel investors, the share of high-earning Black residents ranges considerably by geography.
For example, Baltimore and DC have some of the largest concentrations of Black professionals in the country, even higher than Atlanta. Given its higher cost of living, DC also has the country’s highest rate of high-income earning Black professionals.
Of cities with large Black populations, Philadelphia’s Black professionals have one of the lowest rates of those earning $100K or more — less than Atlanta, Austin, Baltimore, Boston, Chicago, DC, Los Angeles and Miami.
Older White Working Residents
Why? They represent a major economic shift, as older whiter workers fall out of the workplace.
Millions of Americans retired early during the pandemic, hastening what is already inevitable with the aging American workforce. Demographic trends predict a structural shortage of workers.
About 36% of white Americans are over the age of 54, putting them at or near retirement age, according to Pew Research. That’s significantly more than any other racial group.
As such, older workers generally — and especially the city’s aging white population — reflect another important economic trend.
Disabled Residents
Why? They are a growing, diverse and often overlooked part of the American workforce.
When taking together a range of experiences, disabled residents comprise between 5% and 10% of residents in nearly 20 US cities Technical.ly evaluated for this project.
People who use wheelchairs, people who are deaf or hard of hearing, and people who have low vision use physical space in a different way than designers typically consider and perform tasks in a different way than managers typically consider. Advocates argue those perspectives are often overlooked in understanding our future.
Gig-Working Creatives
Why? They demonstrate the vitality, flexibility and economic shortcomings of an emerging part of urban work.
Beat poet Jack Kerouac is credited with popularizing our modern sense of the term “gig work” — a temporary job you are not emotionally invested in but that supports your creative pursuits. Since “gig economy” was coined in 2009, web-powered platform companies that match contract labor with variable demand — think TaskRabbit, Uber and Upwork — have surged. Now a third of Americans contribute to a $1.3 trillion “freelancer economy,” according to past Technical.ly reporting.
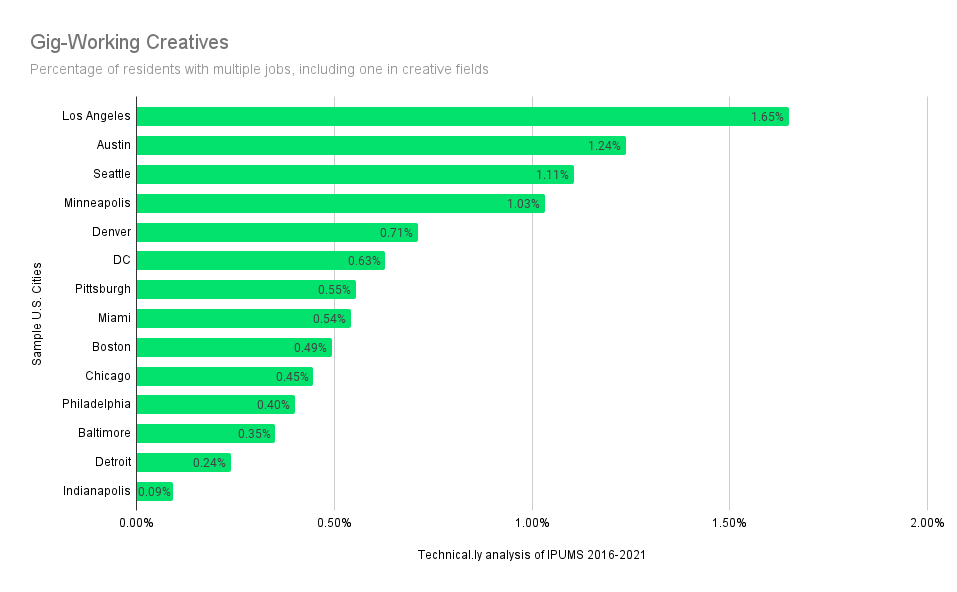
While it’s common for Americans to have varied sources of income, it’s Kerouac’s original intent we’re most interested in: Gig-working creatives, or those whose earnings are split between industries including at least one in an artistic field like music, dance or writing.
As much as any persona group, these artists contribute to the creative makeup of a city — and point to what kind of living is possible.

This report is part of Thriving, a yearlong storytelling initiative from Technical.ly focused on the lived experiences of Philadelphia and comparative city residents. The goal is to generate insights about the economic opportunities and obstacles along their journeys to financial security.
Join our growing Slack community
Join 5,000 tech professionals and entrepreneurs in our community Slack today!
Donate to the Journalism Fund
Your support powers our independent journalism. Unlike most business-media outlets, we don’t have a paywall. Instead, we count on your personal and organizational contributions.

I know civic technology. This is not civic technology.

Baltimore schools cyberattack compromises staff and student data

Inside the GBC/UpSurge merger: A new economic model is forming, and Baltimore is again a pioneer


