Local government in Philadelphia, like in all other cities and regions in the country, focuses policies and programs on improving the city’s economy.
Key to determining which efforts are working is finding an accurate way to measure their effectiveness in creating an equitable future, where all residents in the city have similar opportunities to thrive — and we have an idea for a new metric that does this better than traditional indicators.
Consider that residents are not all starting from the same place. Historical injustices and systemic inequalities form the foundation of a disparity in economic opportunities and wealth in the city. As the gap between the “haves” and “have-nots” in the United States continues to increase, the generalized indicators of economic health — such as gross regional product, job growth and capital investment — do not allow for an accurate reflection of the state of the city’s economy.
It is our opinion that per capita income (PCI) compared across the city’s zip codes provides a more granular and accurate picture of the city’s economic growth, allowing leaders to tie it to efforts to eradicate systemic inequalities.
Per the latest US Census data, the PCI in Philadelphia was about $36,000. This compares to the national median PCI of $41,800.
What exactly is PCI? The Census Bureau calculates it by dividing the total pretax annual income of all individuals 15 and older within a given area by its population. So growth in the city’s economy should improve the overall income of Philadelphians, and therefore, an increase in PCI should be observed.
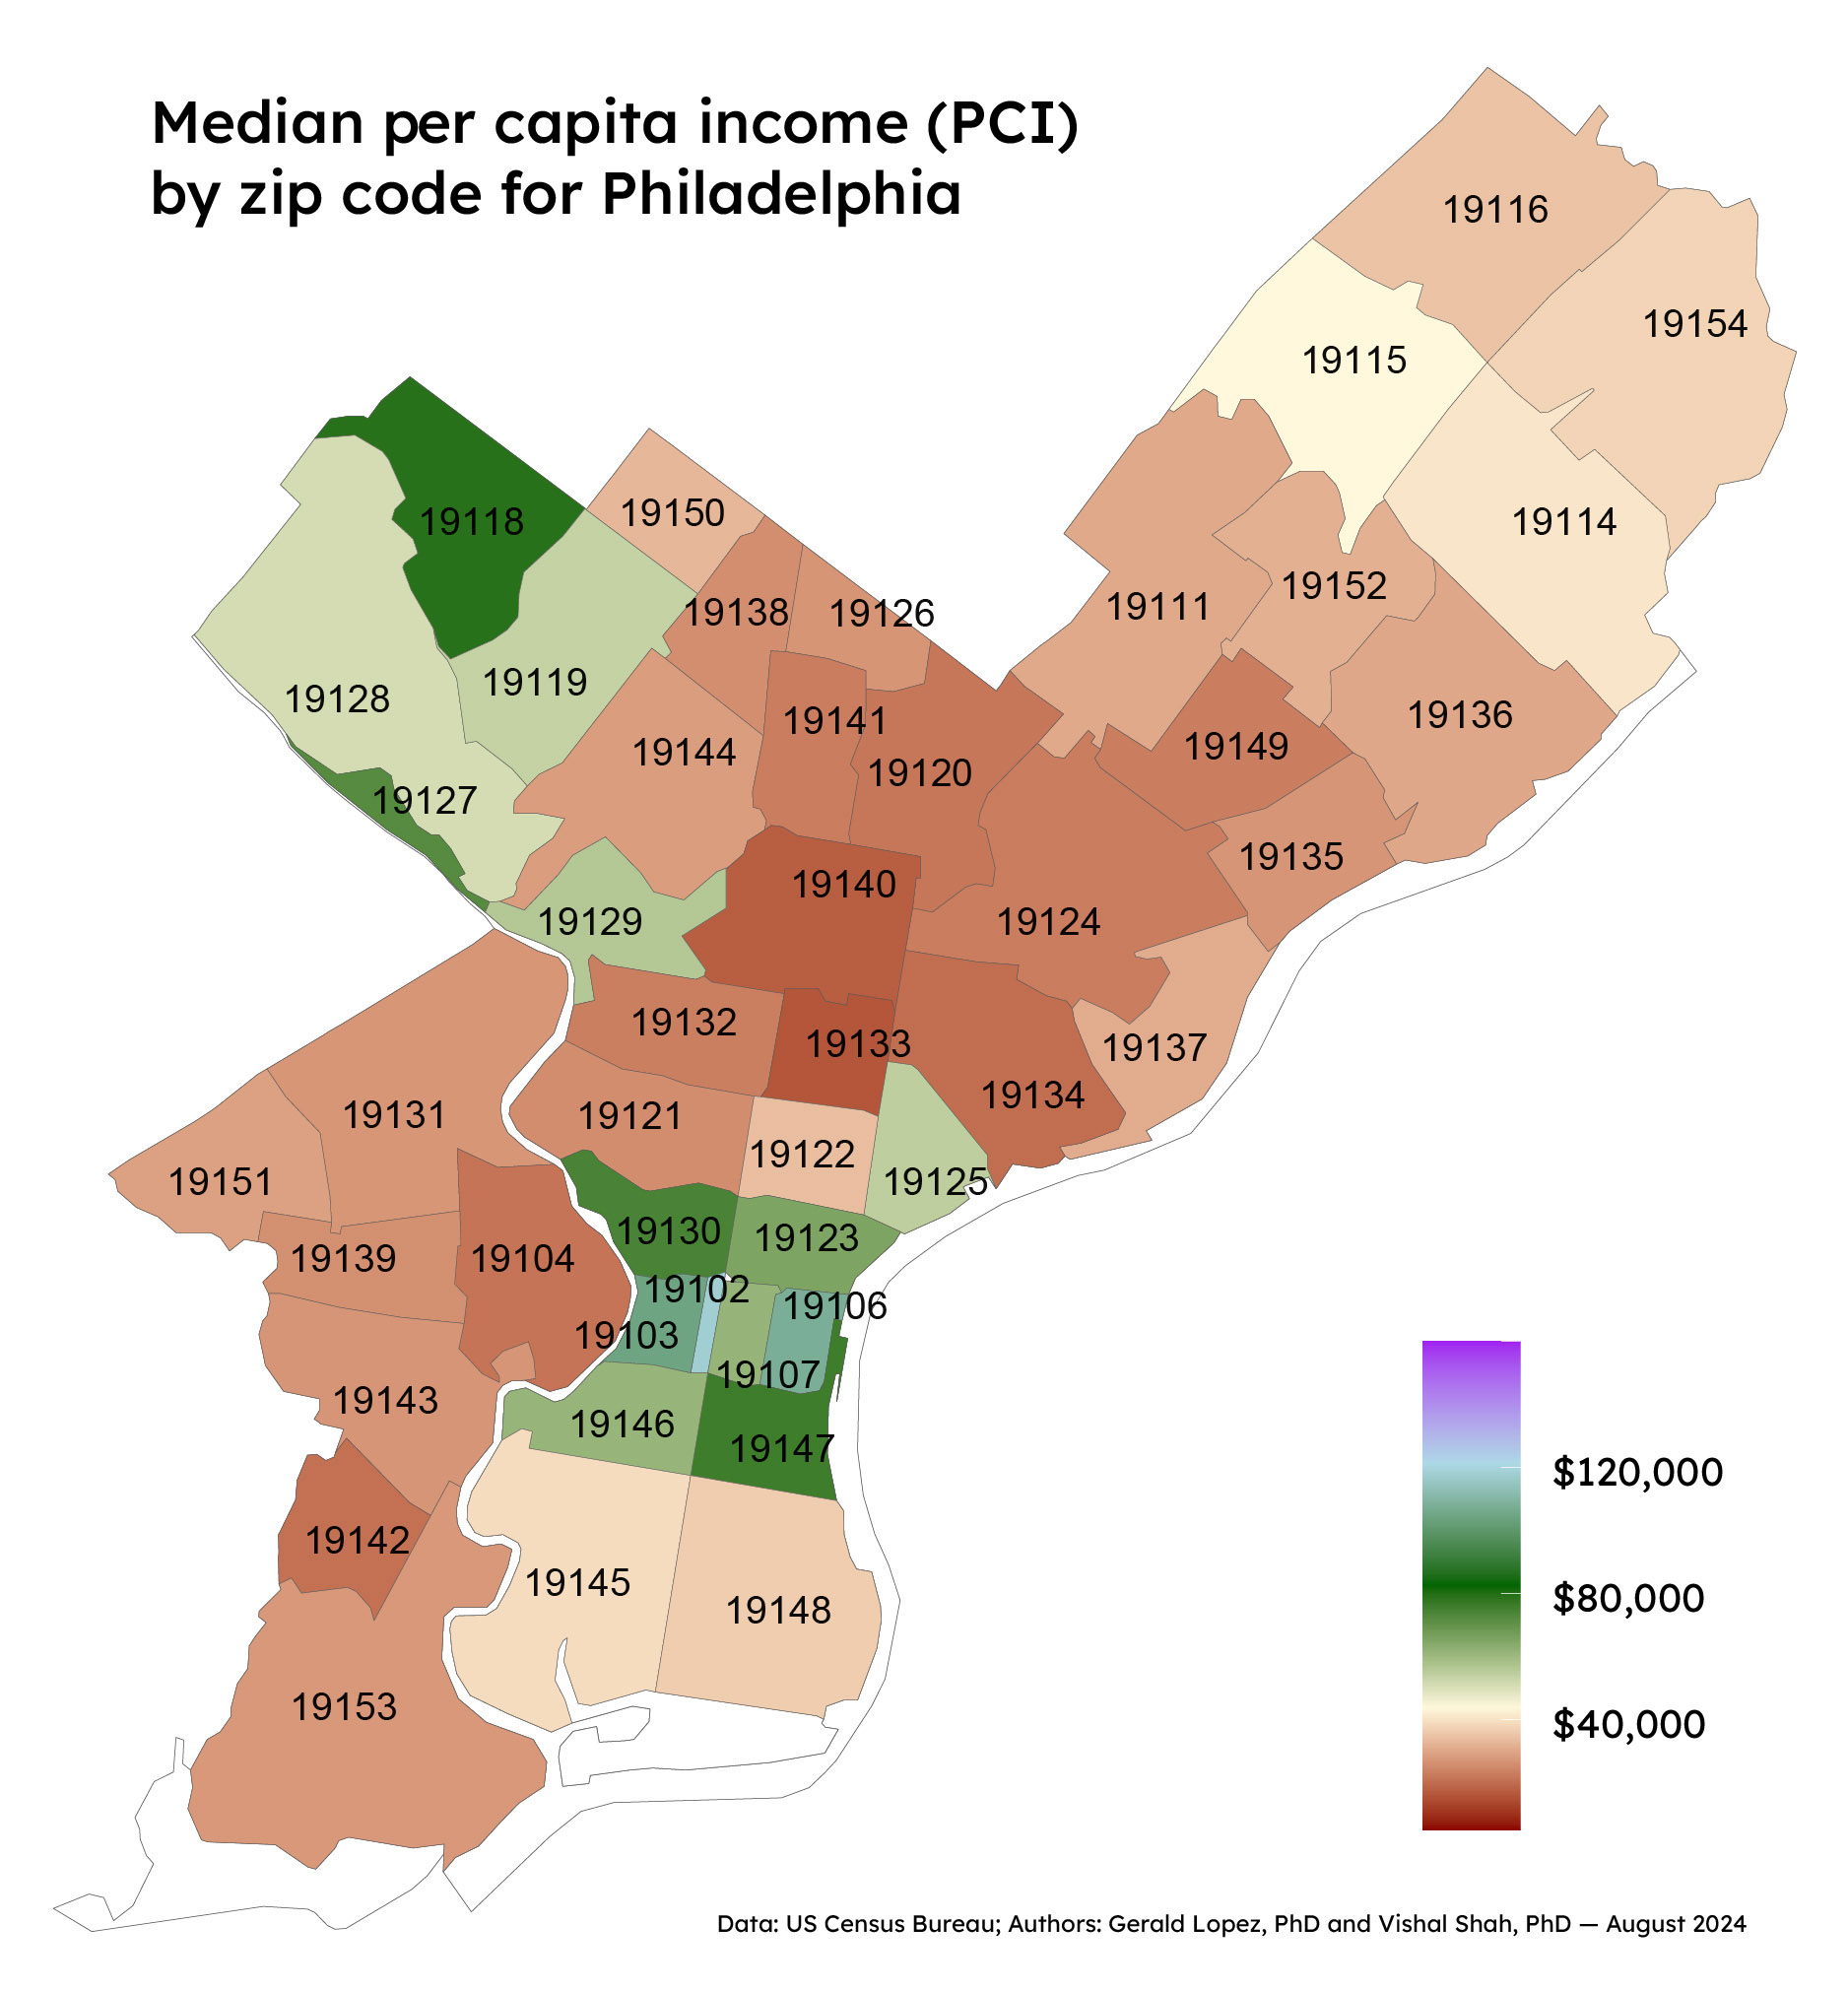
The plot above heat maps PCI across the city, revealing a stark geographical disparity. For example, PCI in the Logan Circle area (19102) is about $118,000. In contrast, PCI in the Fairhill neighborhood (19133) is more than seven times lower, just $15,960.
High PCI zip codes are primarily located in the Center City and Northwest Philadelphia regions. Across all 46 zip codes, only Philadelphians in 19 of them earn more than the city average of $36,075.
“We urge our leaders to observe changes in PCI by zip code as a critical indicator to capture the city’s economic growth.”
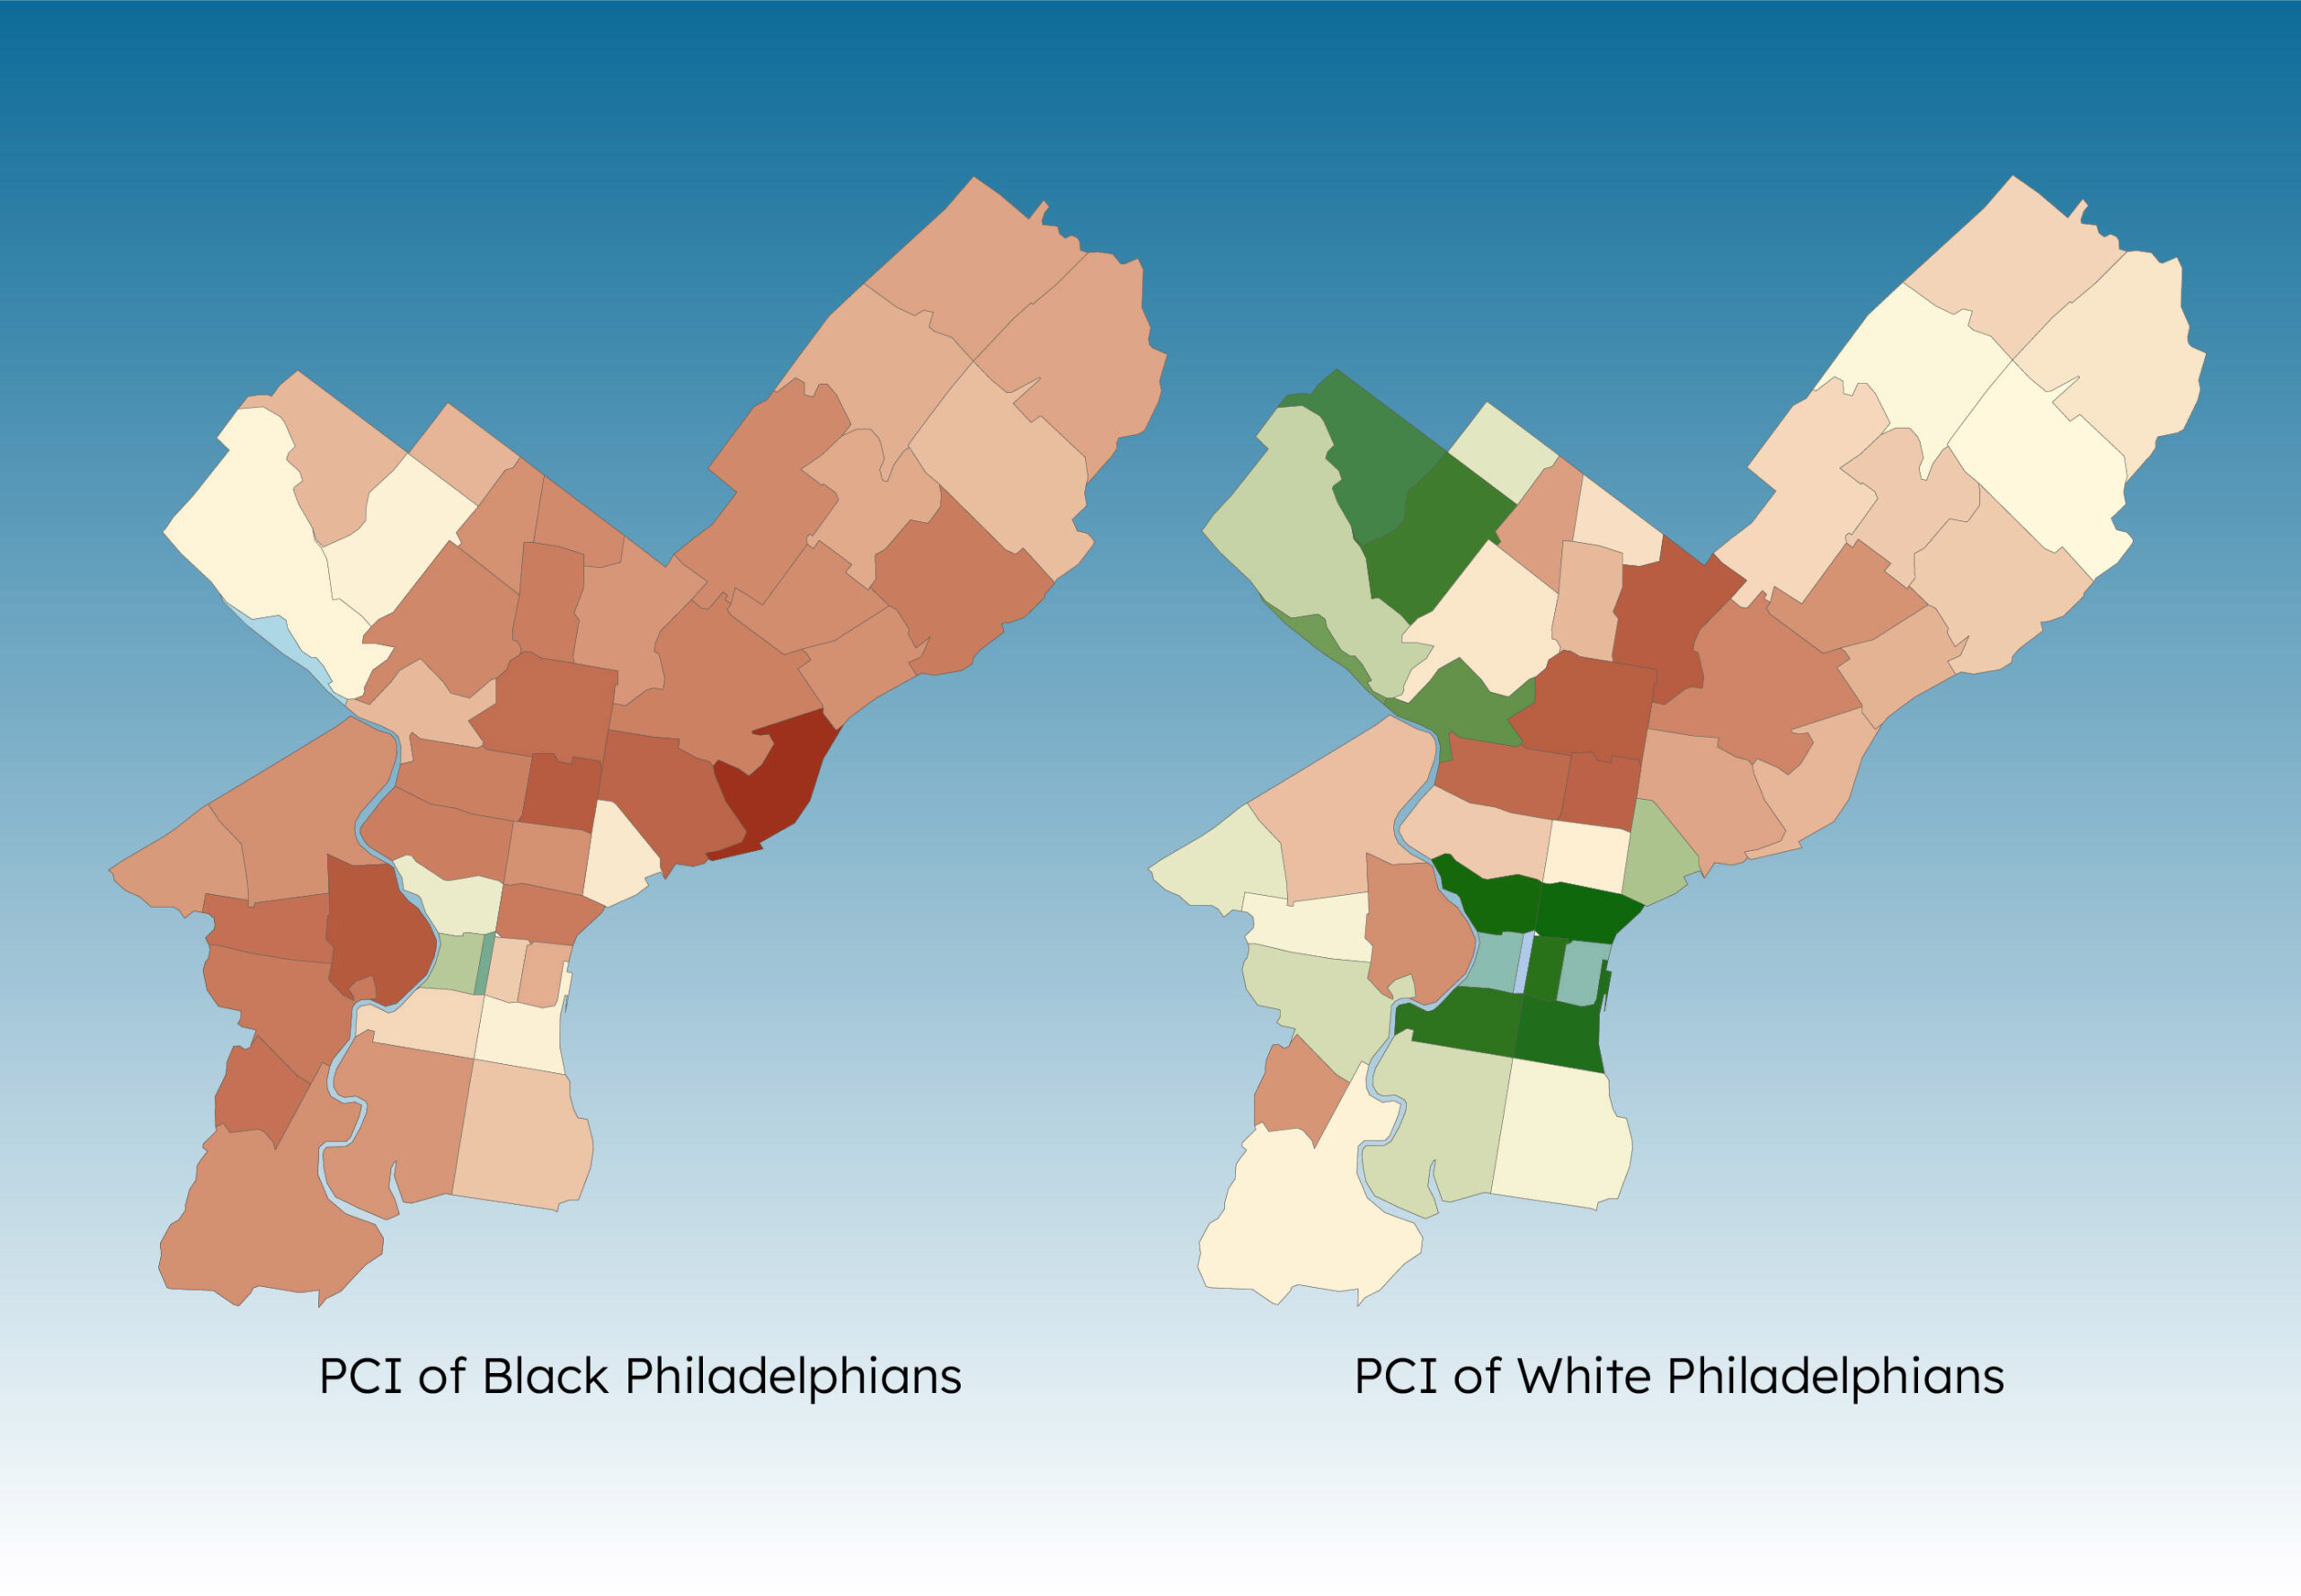
The sizeable disparity is unequivocally a result of generations of failed historic economic policies. It is further compounded by racial inequity.
Compared to white Philadelphians, the Black population earns significantly less. For example, in the Northern Liberties neighborhood (19123), white residents have a PCI more than 3.7 times that of Black residents — around $110,000 vs. $32,000.
A similar racial PCI wealth gap is seen in 42 of the city’s 46 zip codes. In almost all zip codes, citizens of Hispanic or Latino origin earn far less compared to other Philadelphians.
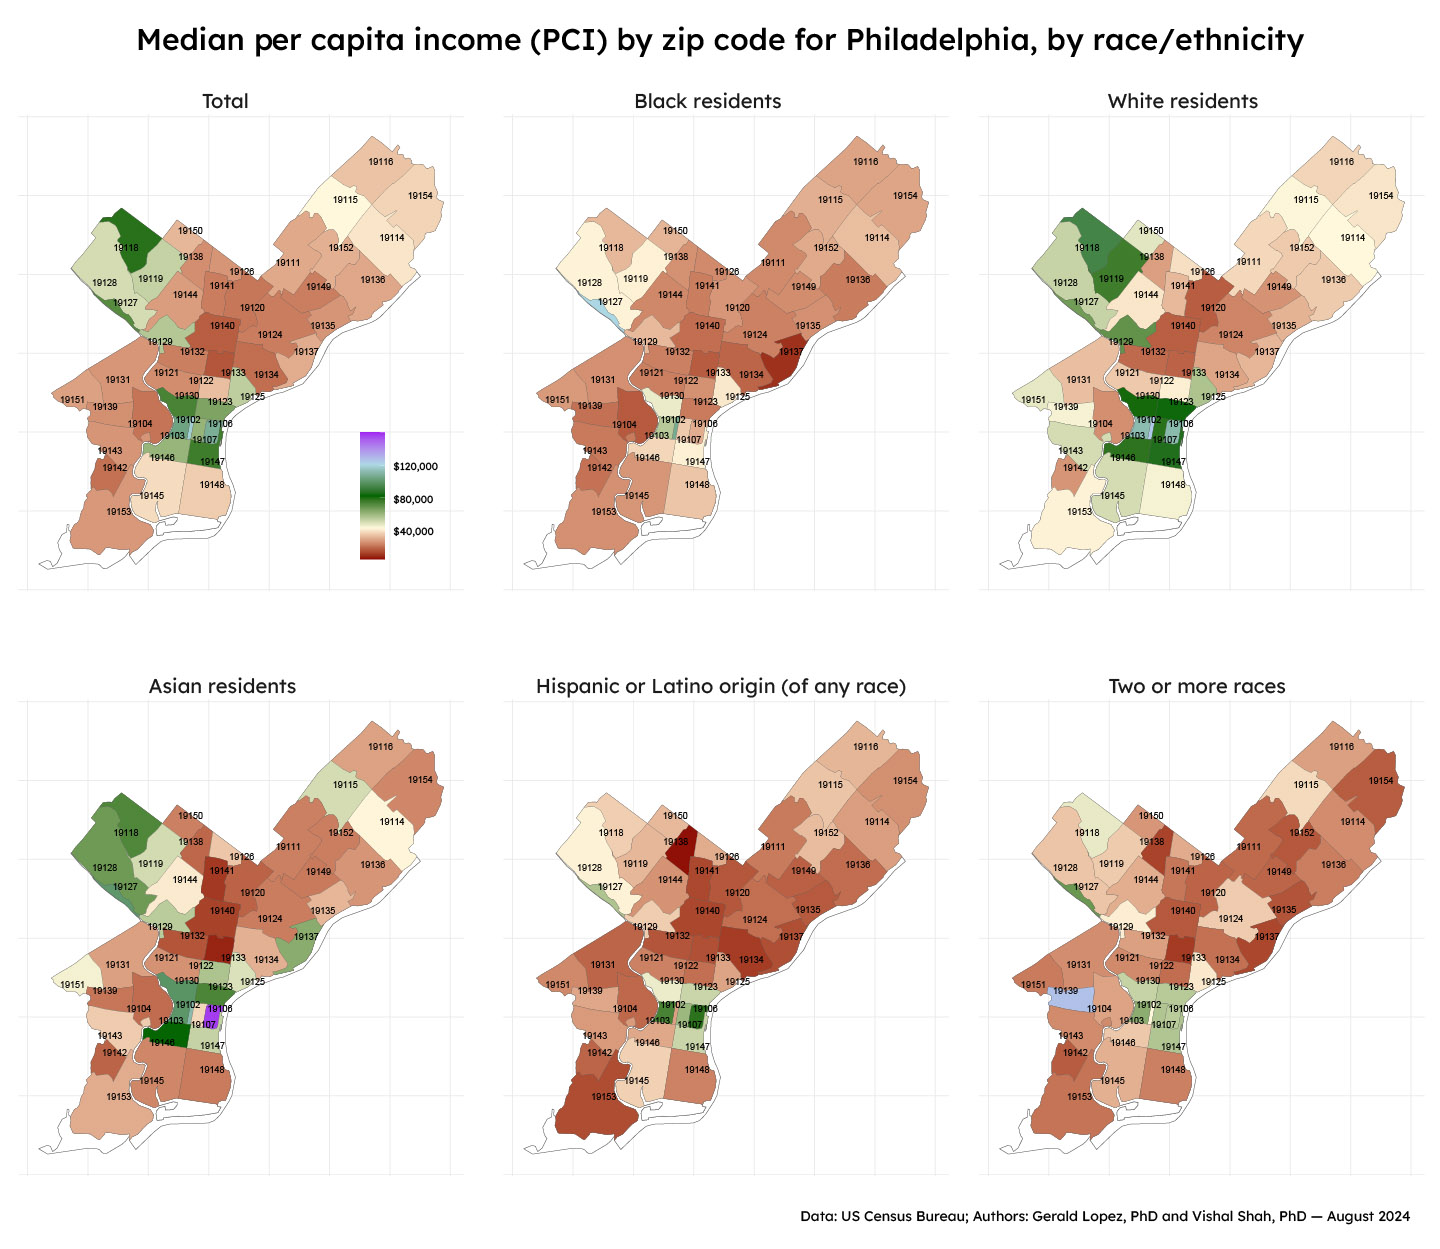
Geographical disparity exists within the racial and ethnic groups themselves in Philadelphia. However, racial and ethnic inequity in PCI is a compounding factor. This combination of inequities only fuels the gap by limiting investment in education, retirement, health and wellness and business ownership.
Research is replete with studies showing the positive impact of addressing the geographical and racial wealth gap in improving access to quality education, quality health care, essential services and reducing the rates of crime and violence.
We urge our leaders to observe changes in PCI by zip code as a critical indicator to capture the city’s economic growth, as it provides concrete evidence of overall growth and can help to eradicate systemic inequalities in financial prosperity.
Bonus: Independent analysis using AI
The following text was generated from Chat GPT-4o-mini analyzing Philadelphia PCI, as part of the authors’ independent research project that leverages an AI-enhanced dashboard.
AI analysis
The salary data across different Philadelphia zip codes reveals notable disparities based on race, highlighting economic inequalities in various neighborhoods.
1. Highest salaries: The neighborhood of Olde City (19106) shows the highest median income for the Asian population at $156,517, followed by Logan Circle (19102) with $125,039 for white individuals. This indicates a trend where predominantly White and Asian areas tend to have higher income figures.
2. Lower income areas: In contrast, neighborhoods such as Allegheny West (19132) and Fairhill (19133) depict significantly lower median salaries, particularly among Black communities ($23,344 and $17,070, respectively). This points towards systemic economic challenges faced by Black residents in these zip codes.
3. Ethnic salary disparities: The data shows a consistent pattern of income disparity across ethnic groups, with white and Asian individuals generally earning higher salaries compared to Black and Hispanic residents. For instance, the average salary for Hispanic residents in many neighborhoods is notably compromised, with median incomes dropping significantly below their white counterparts.
4. Two or more races: The income for individuals identifying as two or more races varies significantly, with noticeable exceptions such as in neighborhoods like Haddington (19139), where they earn $127,015, suggesting a potentially unique economic opportunity or demographic factor.
5. Geographic trends: Predominantly white neighborhoods exhibit a median income range often exceeding $100,000, whereas areas with diverse racial compositions often grapple with lower median incomes, reflecting broader urban socioeconomic dynamics.
This salary data underscores critical societal disparities, suggesting further investigation into factors influencing wage gaps across different demographics in Philadelphia.


