Consider this a snapshot of tech workers’ compensation and lifestyle.
Many Code & Supply members are familiar with our 2017 Compensation Survey and the blog post which served as the primary summary report of the project. There were many other tangible and intangible outcomes as a result of the survey findings. Some of these outcomes included greater transparency into the software and tech job market in the Pittsburgh area, increased knowledge-based leverage capability during job negotiations, and a desire to dig deeper into how software and tech folks are compensated. Community members reported during the last few years that the 2017 survey contributed directly to their compensation negotiations. Those who are new to the software industry, as well as employers, were able to gain insight into what things are like for others in the Pittsburgh software community.
All in all, it was well-received and proved to be very useful. Code & Supply wanted to iterate on and expand the project with a few goals driving future surveys. The construction of the survey questions, deployment, and analysis of the survey responses were areas where we saw room for improvement. Gender, skill levels, diversity, and satisfaction were aspects that we wanted to learn more about. There was also interest in doing more with location data related to where participants live and work, commutes, and any effect or impact on job satisfaction.
In January 2020, we initiated the Compensation Survey Working Group and launched the survey itself coincident with the onset of the COVID-19 pandemic in the United States, where C&S is based. The working group felt it necessary to change some questions to better fit a pandemic world and the data we collected proved to be incredibly insightful. The associated effects of the pandemic impacted analyst volunteer participation and data analysis as well as report generation and release. We’re glad that we carried it through to completion, as the working group and Code & Supply gained many learning and improvement opportunities.
(All images are via Code & Supply.)

The full 106-page report can be accessed at codeandsupply.co/survey. You can read it alongside this blog post for further detail and more graphs, or look at it at a later time. We encourage you to share the following results, and the data in the full write-up widely.
Who makes the most money?
The compensation section includes the foundational results of the survey. These segments of respondents are then represented in each section that follows. We had very few junior developers answer, either by title or by years of experience. Most of Code & Supply’s outreach are tech workers well-established in their careers. We believe this is why the salary data is trending fairly high.
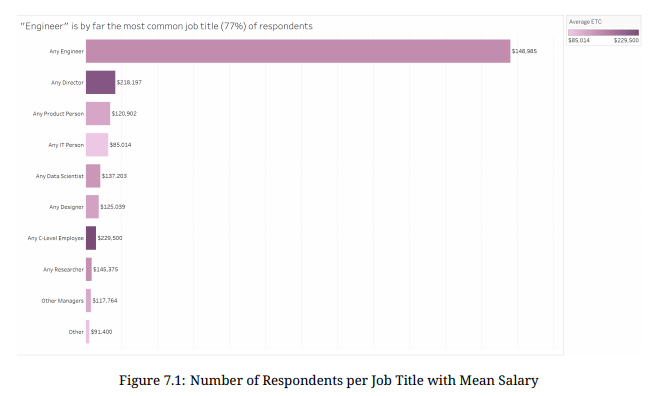
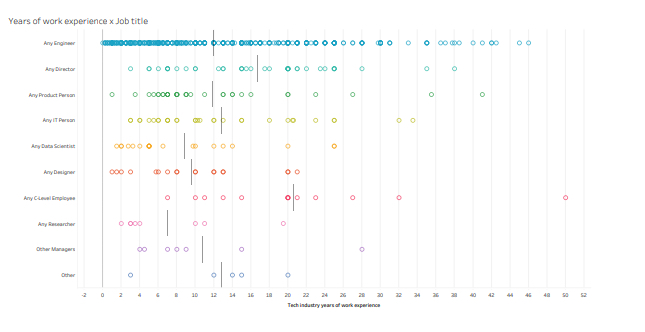
We received responses from 31 different job titles, and most were professions related to software development, software engineering and product management. As could be expected of those participating in a compensation survey distributed by a community focused on software engineering, 77% of respondents reported their job title as engineer. However, we did put efforts towards representing the results of those who are not software engineers or developers.
In order to define segments, we grouped respondents together based on seniority (junior, lead, executive, for example) along with years of experience in comparison to Expected Total Compensation. Another common segment theme we used is satisfaction in relation to the other groupings. These segments and groups form the basis of our core intentions of polling the community.
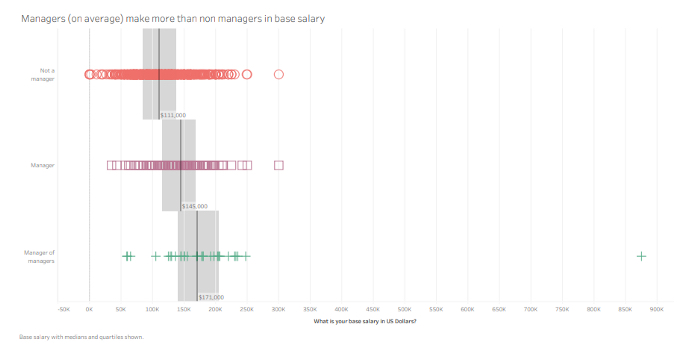
The truth about managers
Respondents who are managers reported the same length of time at their current employer as non-managers. Managers and non-managers are equally satisfied with their compensations, commutes, career paths, and work/life balance.
We found that managers of managers are paid more than managers, but the difference between managers and managers of managers’ total compensation is greater than their base compensation. This reflects that managers of managers are more likely to receive significantly more total compensation, often in the form of higher bonus percentages and equity grants.
Expected total compensation is 25% higher for managers than non-managers and 75% higher for managers of managers.
Most managers (72%) are satisfied or very satisfied with their career path. Similarly, 79% of managers of managers are satisfied or very satisfied with their career path.
Overall, managers and non-managers appear to be similarly satisfied with various sections of their work life, which takes into account all variables regarding their work life.
Is there a wage gap between genders?
We hypothesized that women are paid less than men, even with the same experience and similar hours. This was correct.
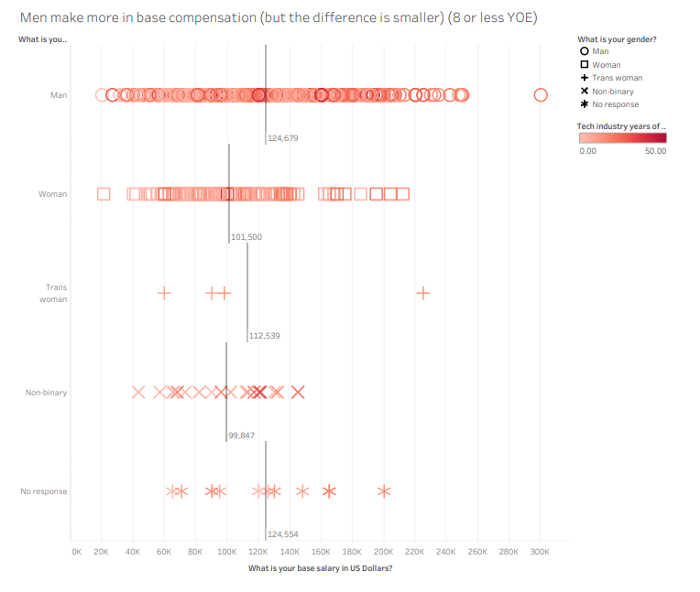
On average, men reported salaries that were 16.6% higher than what women earned. In order to account for average years of experience for men being higher than that of women, likely because more of the respondents were men, we ran the calculation again this time excluding respondents with more than 8.6 years of experience, which was women’s average reported years of experience. Even after filtering the data, men still reported salaries that were 15% higher than what women reported.
Despite this disparity in pay, 60% of women reported feeling “satisfied” or “very satisfied” with their compensation, compared to 73% of men.
Women’s average expected total compensation is about $17,000 less than men’s, and nonbinary people face a larger gap. This even accounts for years of experience worked and hours worked.
Male respondents make 36% more than women in total compensation, even with eight or fewer years of experience, yet only 13% of women were dissatisfied with their compensation. Even when excluding men with more than eight years of experience, they still make more than women and non-binary respondents. We also found that women negotiate at the same rate as men.

Men even make more after adjusting for years of experience.
What about people who don’t code?
The software engineering lifecycle includes people who do not write code as their main job functionality. The engineers and developers who comprise the bulk of Code & Supply’s community rely on those in QA, technical support, and data roles to deliver and support their software.
We did not receive enough answers from folks in product management to do a deep dive into their lives, but we did for other people in tech, such as people involved in system services and tech support. Their salaries tended to be lower overall than engineers.

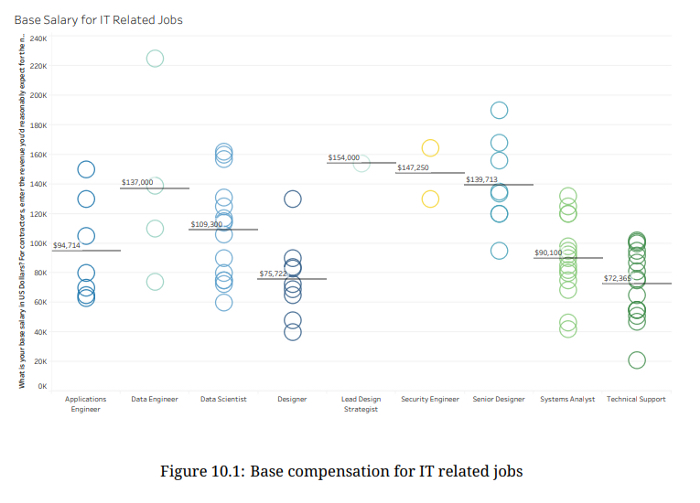
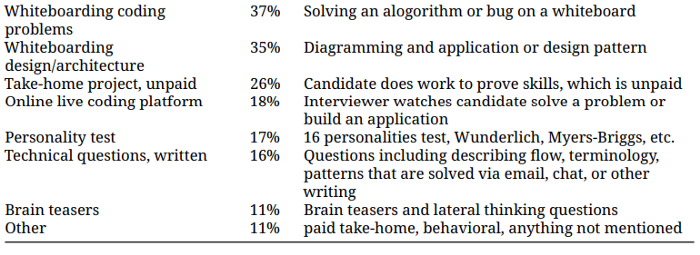
We covered several aspects of this segment of survey participants including raises, job search, and interview experiences.
What goes into finding a job these days?
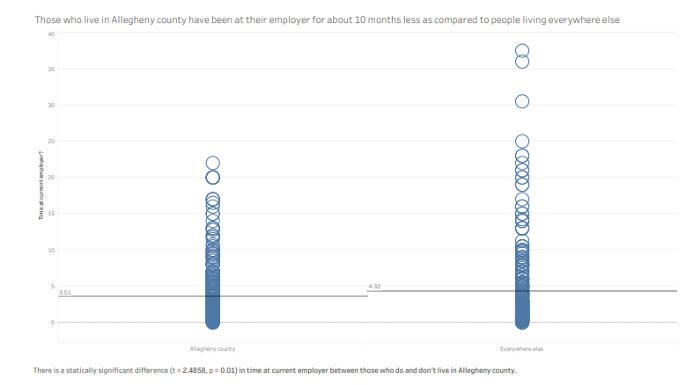
On average, Allegheny County tech workers stay 10 fewer months at their employers with a three-year and six-month average tenure compared with the national average of four years and four months that other respondents reported.

Respondents were much more satisfied with their jobs when they negotiated and their negotiations were either somewhat or completely fulfilled.
Those who negotiated and had their negotiations declined outright were the least satisfied of all respondents, even more so than the respondents who did not negotiate at all.
A strong takeaway here is that companies should always accept some negotiation or say that negotiation is not possible upfront, as soon as it is brought up.
Work-life balance and skills
Most respondents said that their skills are a good match for their current position. There does not seem to be a trend of job satisfaction based on the pay scale. Despite the stereotype that women and minorities suffer from imposter syndrome, only a handful of women — just 4% — considered themselves underskilled for their position, at all pay levels.
About a quarter of respondents received a raise of less than 3%. Approximately one quarter received no raise at all. Less than 1% of respondents received a raise over 10%, but still more than 20% of respondents received a raise exceeding 5%. Women and men both indicated their top career goal was promotion.
Most people work 40 hours a week but a large chunk does not. It’s commonly held that software jobs are typically 40 hours per week, but the responses reflect those “typical” hours are not as strong of reality to a significant portion of respondents. This may indicate work that we as a community have to do to encourage better work-life balance discipline. We know that this is a trending topic across professions given the national shift to “work from home.” While this work arrangement was already quite common across tech industries, we anticipate a continued trending focus and emphasis on work-life balance. This is something we plan on further discussing and analyzing as a community as well as in our next survey project.
We also captured and compiled some analysis regarding skills. The most popular language was Python, followed by JavaScript, SQL, and Java. React was the most popular framework. AWS was the most popular cloud service on the list.
This is a section that we’d like to do more within future survey projects.
Startup analysis
Twenty-two percent of respondents consider themselves to work at a startup. The average salary of a startup respondent is $144,789. The average years of experience for a startup employee is 12.8, with the median being 12 years. We were wondering if Allegheny County had more startups, but the percentage of people working for a startup in Allegheny County is comparable to the nationwide percentage of respondents.
We hypothesized that people who work for startups have a lower base compensation, but higher total compensation because of additional compensation related to equity potential or lucrative bonuses tied to company performance. Our analysis shows this may be generally true based on the responses given in our survey.
Living and commuting
Code & Supply is a nationwide brand in 2021. It has hosted several major conferences drawing nearly 5,000 attendees total. Those attendees reside predominantly in the United States. Dozens are from Canada, Mexico, the United Kingdom, Australia, and a host of other countries. As C&S reaches across the globe, we’re fascinated with where people are living and working.
A majority (53%) of respondents live in Allegheny County (where the city of Pittsburgh is located). This share of the respondents is a contraction versus the 2017 results, in which more than 85% were located in Allegheny County.
This is far more attributable to an expansion of Code & Supply’s reach to a broader, national scale than it is some kind of sudden diaspora from Pittsburgh! Other notable regions include California as well as New York, Ohio, and Colorado. Only 2% of respondents reported living internationally. We note slightly larger groups of respondents in Philadelphia, Cleveland, Columbus, and Washington, D.C., all of which are focus areas of C&S outreach and advertising in conference years. Additionally of interest is growing presence in Chicago; Atlanta; Charlotte, North Carolina; Jacksonville, Florida; Salt Lake City; Dallas; Denver; and Los Angeles, and a host of other smaller cities.
Most people who moved got a pay increase when they moved. A quarter of respondents moved to their current city in the last five years and have changed jobs at least once since then. This suggests that when software professionals move for work, they should expect a salary increase.
More than half of respondents use a car, motorcycle, or other personal gas or electric vehicle to travel to and from work. Approximately 36% of them work from home, pre-pandemic. Most people are satisfied with their commute. In fact, people who work from home are not any happier about their jobs than people who work in an office.
How we created the report
The survey report document includes details regarding methodology, conventions, and terms along with notes regarding the data set. Here are some summary highlights:
- We established hypotheses we then used to form the survey questions. We extensively screened our questions and answers for bias, consistency, and inclusion while also taking steps to ensure the privacy and security of the survey participants.
- The survey was released for participants across a three-month timeframe between May and August 2020.
- The results from the participants were imported into Tableau. We put extensive work into ensuring that each graph and table represented the dataset as clearly as possible while emphasizing the findings of our analysis. We composed and compiled the report so that references to figures, tables, and sections contain hyperlinks for quick jumping to the chart or graph being referred to.
- Trend lines are included on graphs when there is a significant relationship between both axes or across segments of participants. Analyzing for significant relationships while avoiding false positives or mistaking correlation for causation was a key focus activity while processing the participants’ responses.
- We wanted to ensure a clear, unambiguous presentation while seeking to prove or reject our hypotheses. We also wanted to avoid the inclusion of graphs or tables which were interesting “statistical novelties” but did not indicate any true findings. Some survey responses were really interesting to the Working Group, but lacked the ability to be fairly analyzed. If a graph would leave the reader unsure if there was a finding or conclusion, it was left out.
- 785 respondents comprised our sample size, given that they consented to take the survey and reported base salary. Most respondents answered all questions, while 30 abandoned the survey early or skipped at least one question.
Future surveys
We’re very interested to repeat this particular analysis in subsequent years as so much of the software professional community spent most of 2020 working from home. Future surveys will be shorter than the 75 questions in the 2020 survey, in order to streamline analysis. We will also incorporate fewer variables. Some of our questions had over 10 possible responses.
As of December 2020, anecdotally, few C&S members reporting their companies’ plans for 2021 indicated that their employers are requiring employees to return to the office until at least the second half of 2021. We began this survey before the pandemic outbreak and concluded it during the height of the U.S. second wave in August 2020.
There have been anecdotal discussion that tech workers’ wages are stagnating as the market becomes more saturated as more people attend coding bootcamps or study STEM. We would like to explore this in the future.
Feedback
We want your feedback on the results and the survey. Let us know directly via survey@codeandsupply.co or in #compensation-survey-results on C&S Slack.
If you use this report to improve your career, our goal is met. C&S wants to be the best community for software professionals. We want to teach not only new technical skills but also career, professional, and life skills.
If you found it useful and want to thank us, please consider the following:
- Join at codeandsupply.co and become a contributing, sustaining, or sponsor member. Your membership helps fund our operations, including future surveys such as this one.
- Come work with us at the C&S Workspace, our coworking space designed for software professionals in Pittsburgh but open to all, including students, freelancers, and non-tech folks. It shares a space with our Community Center in East Liberty. We are open during the COVID-19 with expected government restrictions and precautions in place.
- Donate to the C&S Scholarship Fund at codeandsupply.fund, our charitable sibling organization which aims to award scholarships to a wide array of underrepresented groups in the tech community. Donations are tax-deductible.
- Join us at our conferences, such as Heartifacts and Abstractions.
Sponsors
We thank Tech Elevator, Braintree, RustBuilt, Womxn in Tech Pittsburgh, and StartNow (acquired by Technical.ly) for their support of this project. They did not influence responses nor receive private data.
The full survey
As alluded to above, don’t forget to download the full survey report:
Download the full reportThanks to C&S’ Colin Dean for editing the original post. If you’d like to participate in our future surveys or our survey working group, join us in #team-survey on C&S Slack or sign up for the C&S mailing list.

This guest post is a part of How We Work Now Month of Technical.ly's 2021 editorial calendar.
Before you go...
Please consider supporting Technical.ly to keep our independent journalism strong. Unlike most business-focused media outlets, we don’t have a paywall. Instead, we count on your personal and organizational support.
Join our growing Slack community
Join 5,000 tech professionals and entrepreneurs in our community Slack today!

Entrepreneurship is changing, and so is the economic development behind it

Tech Hubs’ new $210M funding leaves Baltimore and Philly off the table

Here’s what to know before using AI to craft your brand’s social media posts


