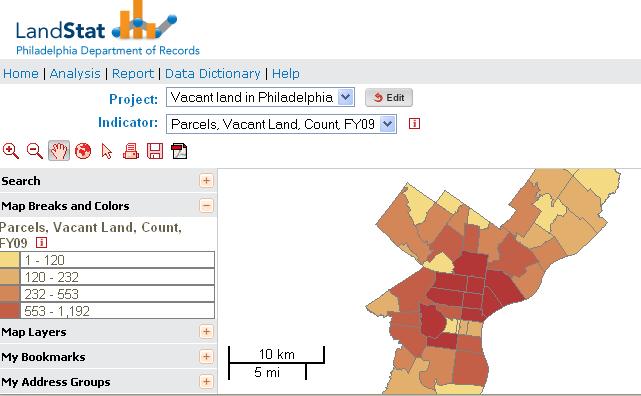
This isn’t quite the type of city government Web site you might expect in Philadelphia.
Aggregating millions of Philadelphia real estate transactions into a set of reporting and analysis tools, LandStat is the fully-functioning love child of the city’s Department of Records and Avencia, the wonkish Callowhill-based geographic analysis and software development firm.
Using its Kaleidocade Indicators Framework platform, the site was originally designed to help city staff visualize and interpret geographic patterns and trends in the city’s real estate market. The partnership is perhaps just one of the more impressive publicly accessible web-based applications from records department data.
LandStat includes information on individual property transactions from a variety of systems that are then geocoded to a map location and fitted with ZIP Codes, City Council districts, wards, U.S. Census tracts, and other grouping. That aggregated dataset was fed into Avencia’s Kaleidocade software, a web-based analysis and visualization program.
Including categories on mortgages, deeds, Sheriff’s deeds to indicate foreclosures, real estate transfer tax and property types, as a press release from Avencia’s Abby Fretz reads “LandStat enables city planners, real estate investors, or any interested users to create thematic maps, chart trends over time, get detailed reports on specific geographic areas of interest and perform complex analysis through a straightforward interface using only a web browser.”
The maps, charts, graphs, rankings and other statistical displays are fun, if overwhelming, to explore.
Join our growing Slack community
Join 5,000 tech professionals and entrepreneurs in our community Slack today!
Donate to the Journalism Fund
Your support powers our independent journalism. Unlike most business-media outlets, we don’t have a paywall. Instead, we count on your personal and organizational contributions.

RealLIST Startups 2025: Meet 20 Philly startups hot on the track to success

Half of Pennsylvania’s federal buildings are set to be sold under Trump admin plan

Biotech startups are still winning federal grants, accelerator founder says — but the money is taking longer to trickle in

