
Following a data-driven look at the pandemic’s impact on the city, Baltimore Data Week 2021 offered a tutorial on illustrating the deep inequities impacting Baltimore’s Black Butterfly.
Colin Starger, founder and director of legal data and design at the University of Baltimore, gave a workshop on how to write the code that creates a visualization of the Baltimore Neighborhood Indicators Alliance’s (BNIA) data on these inequities.
It is hard to convey just how powerful @ColinStarger's seemingly geeky session was..You just have to watch.
"This is a powerful indictment of structural racism, rooted in data"
Using BNIA APIs to Visualize Baltimore’s ‘Black Butterfly’ https://t.co/lokildaCik #BaltimoreDataWeek— Seema Iyer (@seemadiyer) July 22, 2021
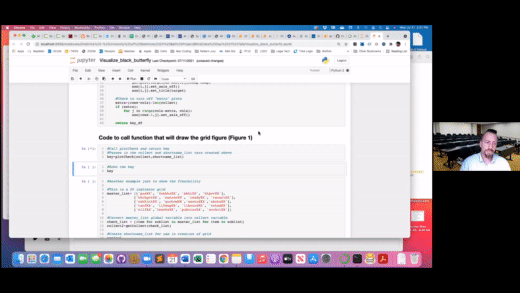
The specific project Starger covered was Visualize_black_butterfly.ipynb, the code for which can All of the code can be found on Starger’s GitHub. He used Jupyter as his development environment and created a Jupyter Notebook which just allows a more feature-rich sharing of the coding files and documents. But if Jupyter isn’t your cup of tea as a work environment, note that it’s all coded in Python at the most basic level.
To get started on visualizing your data, all you need is the Jupyter Notebook and the BNIA API.CSV in Starger’s GitHub. The process from there is to plug in the variables, and then the code outputs a heat map of the data inputed using the libraries or prewritten code like GeoPandas and matplotlib.pyplot that turn the data into a geomap and heat map. These libraries all come neatly package in the GitHub code.

(Gif by Technical.ly)
Starger is going to use this data in a legal context for research he’s been doing about the criminal system in the United States.
“Not everything has the same disparity,” Starger said about what he’s been seeing as he created data visualizations of the Black Butterfly. “Not everything is all bad news and maybe you want to look in and visualize where something positive is happening. This basic stack would allow you to do that, and you can write additional code and work with your coder friends to do that as well.”

(Gif by Technical.ly)
Also, for a bonus lesson, here’s a quick trick in Word for Mac users to convert a huge block of text into a table; in this case it was the shortname and indicator key for the code in this GitHub project. You highlight the text, go to “Table,” then “Convert,” “Convert to table” — and voilà, nice clean table for API shortname indicators.

How to convert text to tables. (Gif by Technical.ly)
You can check out the full tutorial at BNIA’s YouTube channel:
[youtube https://www.youtube.com/watch?v=Zb3K8GnD8G4]
Donte Kirby is a 2020-2022 corps member for Report for America, an initiative of The Groundtruth Project that pairs young journalists with local newsrooms. This position is supported by the Robert W. Deutsch Foundation.Before you go...
Please consider supporting Technical.ly to keep our independent journalism strong. Unlike most business-focused media outlets, we don’t have a paywall. Instead, we count on your personal and organizational support.
3 ways to support our work:- Contribute to the Journalism Fund. Charitable giving ensures our information remains free and accessible for residents to discover workforce programs and entrepreneurship pathways. This includes philanthropic grants and individual tax-deductible donations from readers like you.
- Use our Preferred Partners. Our directory of vetted providers offers high-quality recommendations for services our readers need, and each referral supports our journalism.
- Use our services. If you need entrepreneurs and tech leaders to buy your services, are seeking technologists to hire or want more professionals to know about your ecosystem, Technical.ly has the biggest and most engaged audience in the mid-Atlantic. We help companies tell their stories and answer big questions to meet and serve our community.

Join our growing Slack community
Join 5,000 tech professionals and entrepreneurs in our community Slack today!

The person charged in the UnitedHealthcare CEO shooting had a ton of tech connections

From rejection to innovation: How I built a tool to beat AI hiring algorithms at their own game

Where are the country’s most vibrant tech and startup communities?
