

It’s the kind of conventional wisdom managers comfort each other with after another employee departure. The so-called Great Resignation of 2020-2022 only exacerbated the hopelessness.
The trouble is this narrative just isn’t true. Employee tenure rates haven’t actually shifted much in decades.
In 1983, the median tenure of a salaried American employee aged 25 or older was five years. That median tenure 40 years later, even after the pandemic? Still five years. Go back further still and you’ll see that today’s tenure rates among young people and older workers are remarkably similar to those in the 1950s.
How the pandemic changed employee tenure
That’s all according to a new analysis from the Employee Benefit Research Institute (EBRI), which demonstrates that most Americans never had long-term, single-employer careers. It’s pure myth.
This is not to say 2020-2022 wasn’t a chaotic time to hire. It was. Based on data from the US Census Bureau, EBRI researchers say tenure was actually trending up — before the spike in pandemic-era quits. So tenure was cut by the pandemic, but just back to the levels we had when Dwight Eisenhower was president. Moreover, pandemic quit rates were similar to those in 1948 and 1973, according to an overlooked paper by the Federal Reserve Bank of San Francisco.
Analysts and economists have been largely gloomy about the economy of late, warning of a possible 2023 recession. Yet economic fundamentals remain strong in the United States. Unemployment claims continued to trend downward, according to the Bureau of Labor Statistics (BLS) in recent weeks — and productivity gains were up.
“Hiring is still very much active and alive,” said Dave Fisch, the CEO of high-income jobs site Ladders.com, in an interview with Technical.ly.
What is the average turnover and tenure at tech companies?
A Crunchbase tally indicates that almost 60,000 tech jobs have been cut in 2023 so far — joining the 150,000 layoffs in 2022. Yet high-profile tech layoffs, despite all the attention they receive, aren’t yet representative of any wider trend; they just reflect that industry’s boom and bust culture.
As another labor market observer told Technical.ly: “This could be the most advertised recession that never comes.”
Between summer 2021 and 2022, tech really did have one of the highest rates of employee turnover of any industry in the US. When grouped with media (hi there!), tech companies had an average turnover rate of 12.9%, according to LinkedIn research — only grueling management consulting fared worse. Contrast that with the national average of 10.6%, and the average 100-employee tech company churned out three more employees — at a cost of replacement that Workhuman research pegged at more than 100% of their salary.
LinkedIn also reported that HR, product management and marketing roles had the highest turnover rates while those in operations, finance and business development did the best. Software development jobs were somewhere in between.
Tech’s reputation for short tenure rates comes from the cutthroat culture of Big Tech companies.
A 2017 analysis put average employee tenure at Facebook, Airbnb and Tesla below three years; Netflix, Google and Salesforce didn’t fare much better. Median tenure of software developers in particular at big tech firms has been pegged at just two years, according to a Hackerlife analysis.
Tenure rates are higher outside of Silicon Valley — and even at more traditional firms within it. Adobe and Cisco have reputations for longer employment tenure. Turnover rates are lower at bigger firms in part because of the law of small numbers — if a single employee leaves a four-person company, it has a 25% turnover rate.

The EBRI’s tracking of male workers’ median tenure levels. (Courtesy image)
How tenure rates vary for men and women, age and sector
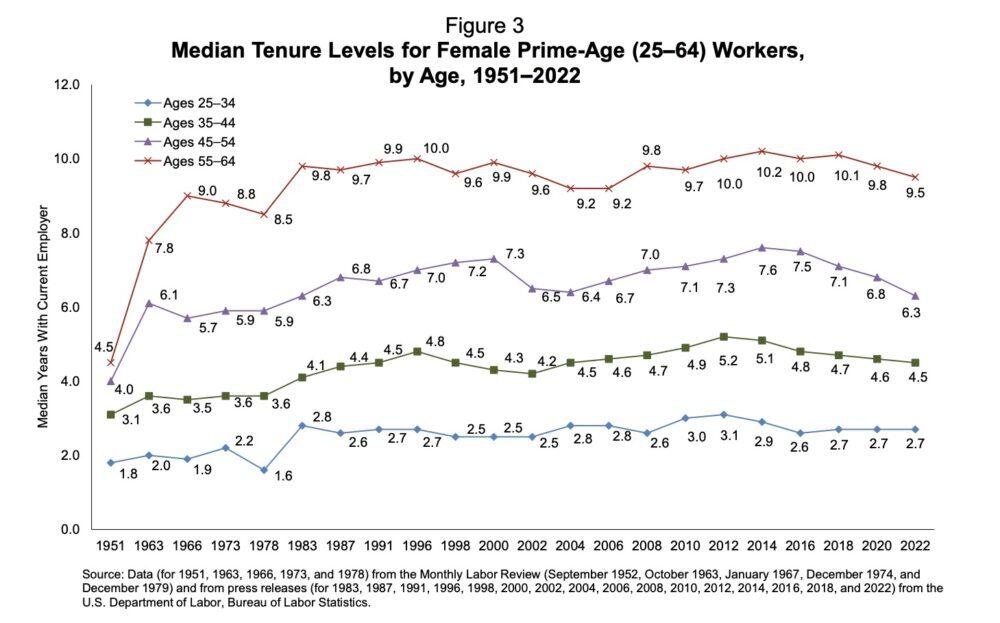
EBRI’s data showing flat tenure rates mask a juicy nuance: Over the last 40 years, median tenure among women is way up, as the percentage of women in the workforce steadily climbed — though it has shrunk again following the Great Recession. In contrast, tenure among men has slid down as they leaked out of the workforce. Still, the median tenure among American men aged 25 or older stood at 5.1 years in January 2022, according to a BLS analysis, which was higher than the 4.7 years for women.
Though tenure rates have otherwise proved remarkably consistent, there are wide variations. For example, median tenure varies considerably by age, between the private and public sectors, and by organization size.
Median tenure for young professionals (25 to 34 years old) was practically the same in 1951 and 2022, at under three years. For older professionals (55-64), tenure was three times as long — up from about nine years in 1951 to 10 in 2022.
Public sector workers have nearly double the tenures of private sector ones: Median tenure for American company employees in 1983 was 3.6 years, while it went up to four in 2022. Tenure for a government worker in 1983 was six years, which was up to seven in 2022.
In short: The average young professional in the 1950s would spend less than three years at a given employer, and even less if it was a smaller company. The same would be true six decades later, except that today, the professional is much more likely to be a woman.
The EBRI’s tracking of male workers’ median tenure levels. (Courtesy image)
What happens next?
As durable as tenure rates have been over the decades, they experienced fluctuations over shorter periods of years. Like so much data analysis, you can find different stories depending on how far you zoom out.
Last spring, an economist told me something that fits now: In digesting data, we often misunderstand what a story is because it’s a long representative trend and/or bucks that trend. In the case of employee tenure, it’s a long representative one.
Frenetic periods can be exceptions without becoming new rules. This is an important lens for understanding your own organization.
Older workers stay longer; younger workers leave more often. On the whole, a workforce with a median tenure of five years is something to celebrate. If you only lose one employee each year for nine that you keep, then you’re exceptional. Keep the stars longer, and get comfortable with others staying shorter.
Just do me a favor and correct the next person who tells you that no one stays in their job for long anymore.
Sign up for the Culture Builder newsletter
Written by Technically Media CEO Chris Wink, Technical.ly’s Culture Builder newsletter features tips on growing powerful teams and dynamic workplaces. Below is the latest edition we published. Sign up to get the next one.
Before you go...
Please consider supporting Technical.ly to keep our independent journalism strong. Unlike most business-focused media outlets, we don’t have a paywall. Instead, we count on your personal and organizational support.
Join our growing Slack community
Join 5,000 tech professionals and entrepreneurs in our community Slack today!

The person charged in the UnitedHealthcare CEO shooting had a ton of tech connections

From rejection to innovation: How I built a tool to beat AI hiring algorithms at their own game

Where are the country’s most vibrant tech and startup communities?
