As respiratory virus season gains momentum, Pittsburgh-area residents have a new tool to help them track viruses in real time.
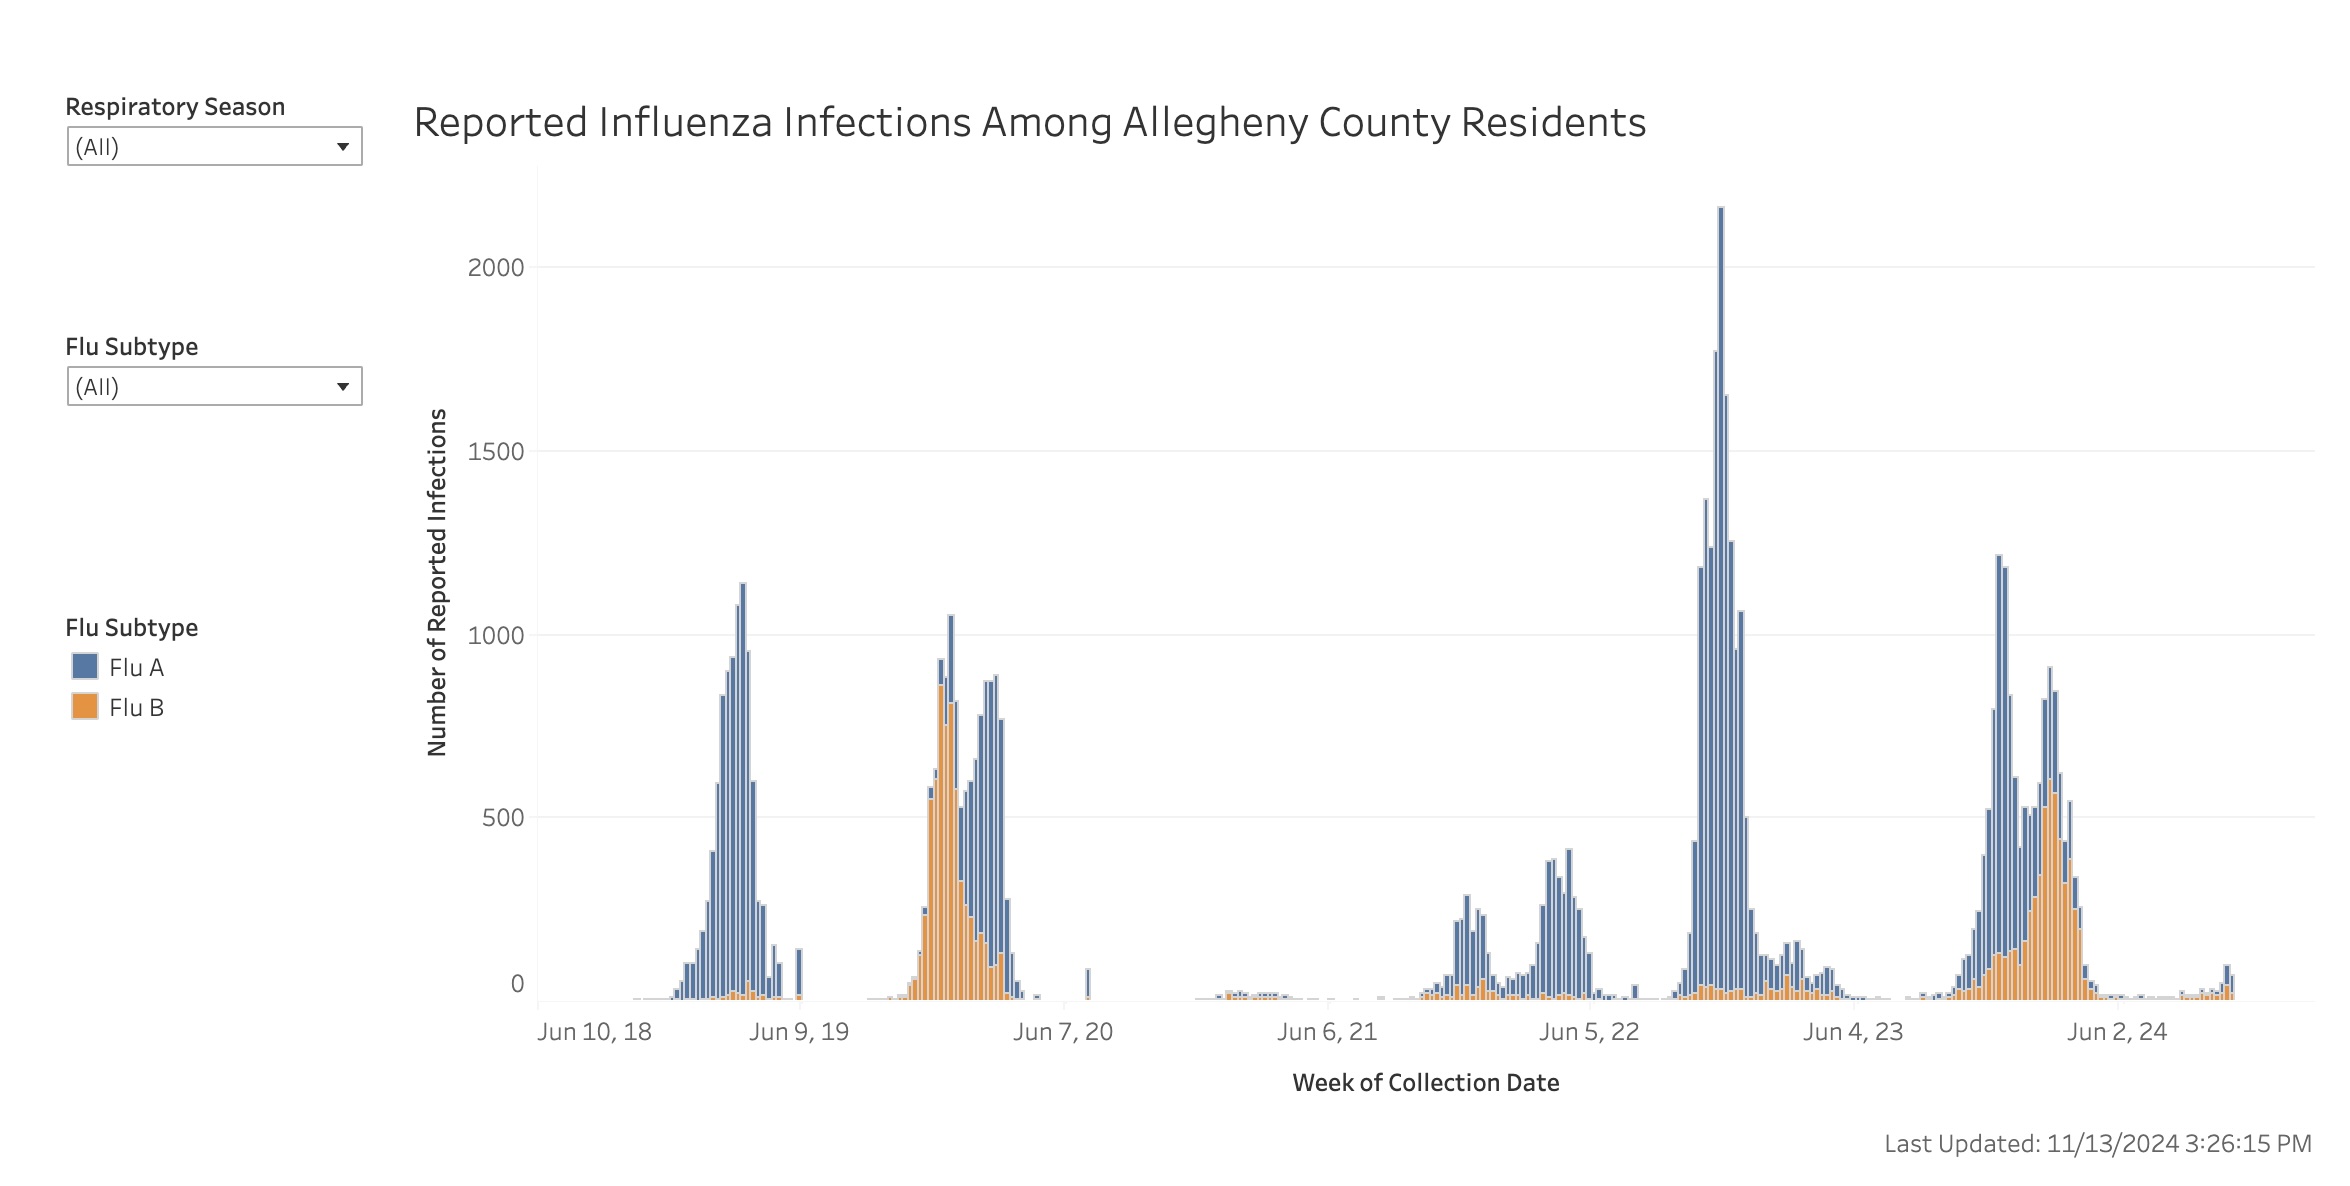
The Allegheny County Health Department (ACHD) recently launched a respiratory virus dashboard that tracks cases, hospitalizations and deaths for COVID, influenza and RSV, creating a centralized hub for critical public health information. And it’s a crucial reminder that these diseases are still present — and still deadly.
Creating a dashboard to track viruses like the flu comes after the county’s success with the COVID tracker, according to Kristen Mertz, the county’s medical epidemiologist. It garnered substantial public interest, and there was a lack of information out there about the spread of other viruses.
“COVID is still affecting many residents, and we want to continue providing up-to-date data,” says Mertz. “Additionally, flu and RSV levels have returned to what we saw before the pandemic and these viruses continue to cause severe illness.”
The dashboard displays data in a straightforward format, showing residents not only the current virus, but also including Pennsylvania’s disease surveillance system, CDC reports and local death certificates.
The ACHD’s epidemiologists compile this data and update the dashboard every week. It was developed using Tableau software, with data queries built using SAS Studio.
“The goal is to help people make informed decisions about their health, whether that means considering vaccinations or staying home if they’re sick,” Mertz said.

Keeping residents, especially high-risk ones, informed
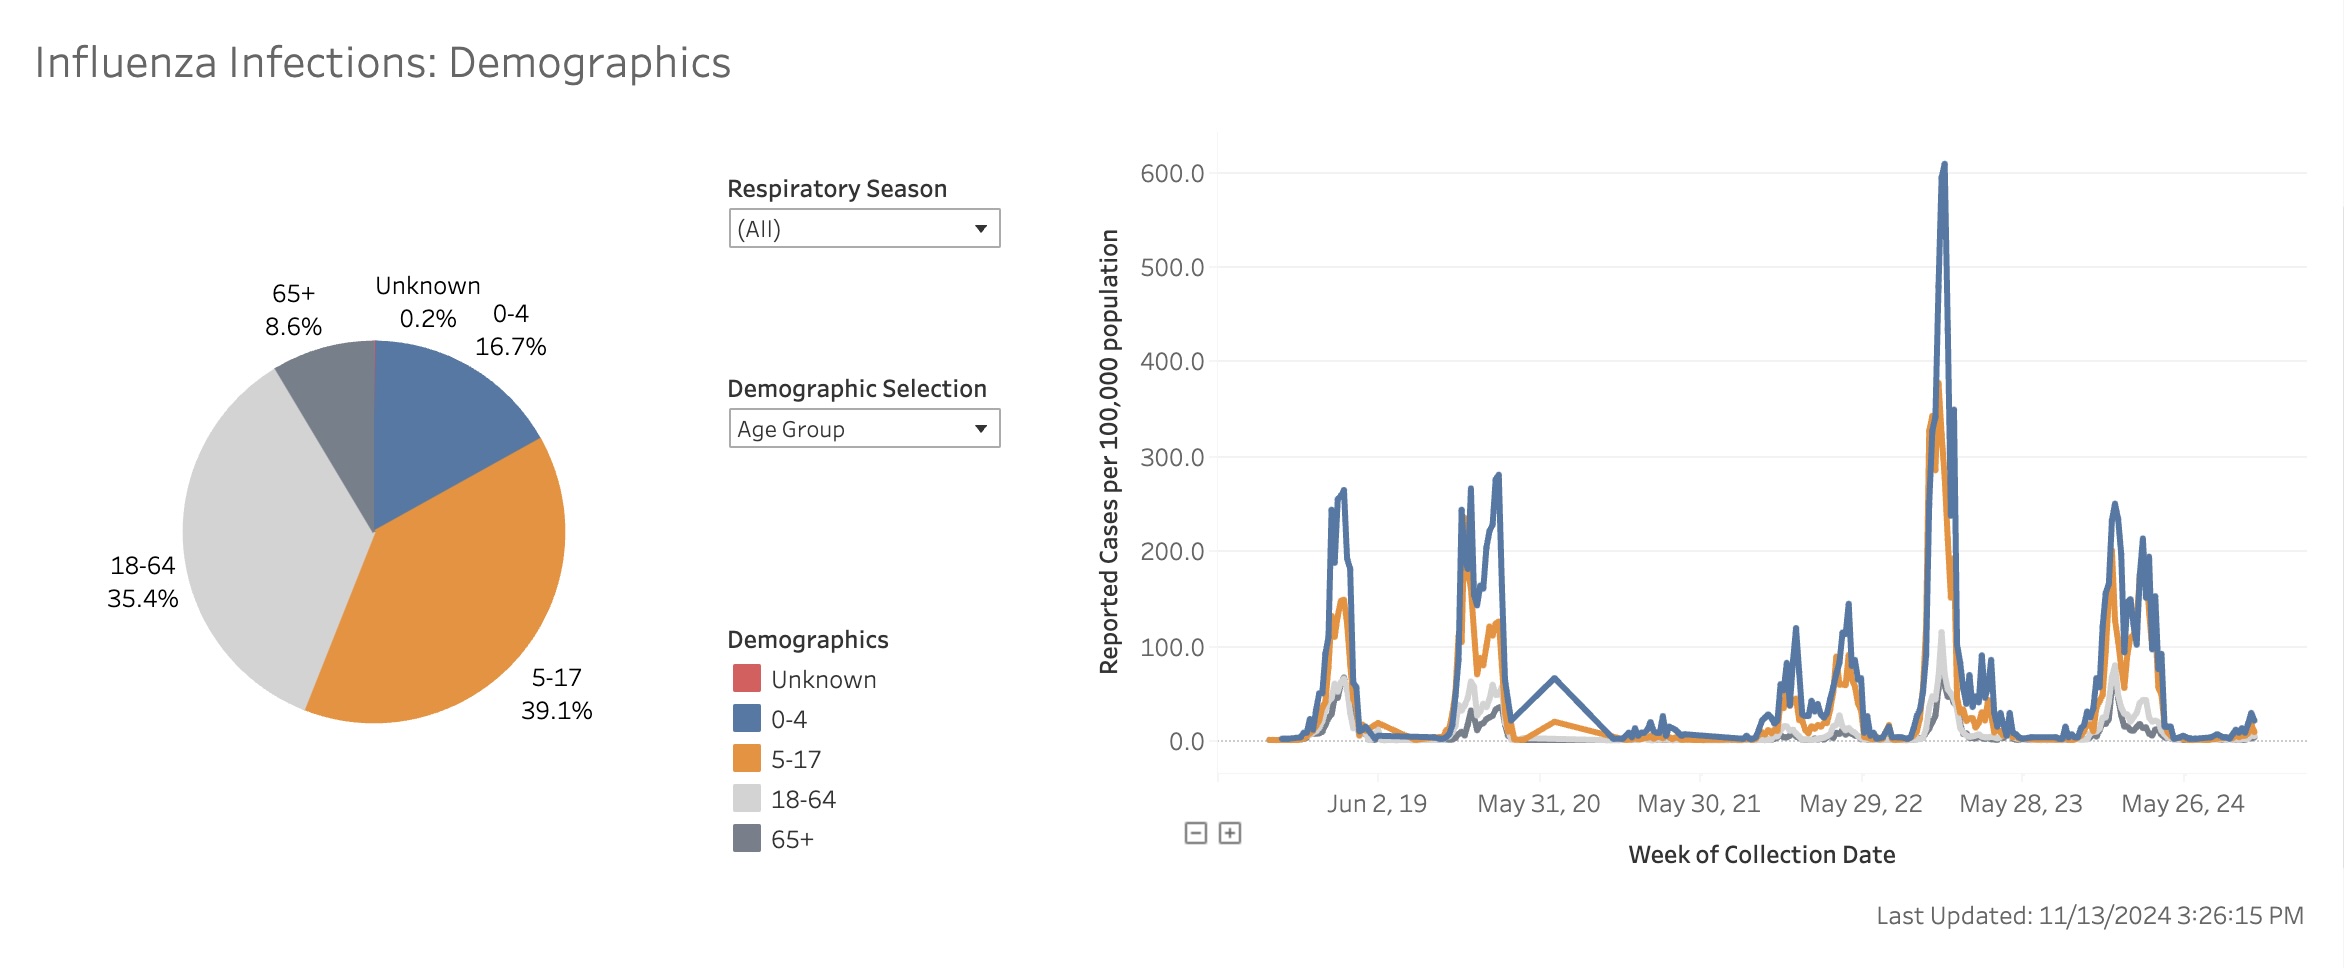
The dashboard breaks down the data by age, race and ethnicity, an important feature that highlights which groups are at the highest risk for severe outcomes.
For example, the data shows that individuals over 65 are far more likely to experience severe illness or death from COVID.
“It’s essential that people in these high-risk groups are aware of the dangers and take preventive measures, like getting vaccinated and seeking treatment if they develop symptoms,” said Mertz.

While not all cases of these respiratory viruses are reported — many people rely on at-home testing or don’t get tested at all — the dashboard still provides a solid overview of the trends, according to Mertz.
Hospitalizations and death data in particular give a clearer picture of the burden these diseases are placing on the healthcare system.
“People may not realize that in late August and September, over 100 people per week were being admitted to hospitals in Allegheny County for COVID,” Mertz said.
Still, one of the biggest challenges is getting people to pay attention, as many have become less concerned about these diseases, according to Mertz. The county hopes that by making this information readily available, residents will take more precautions.
Virus trends help policymakers, healthcare professionals prepare
In addition to helping residents stay informed, the dashboard is a valuable tool for healthcare providers and policymakers. It allows them to monitor trends in real-time and prepare for surges in cases.
Plus, it shows them the severity of the current strains. For example, there were 355 COVID-related deaths in 2023, according to Allegheny County. The dashboard also serves as a public reminder: vaccination is still your best defense, according to county officials.
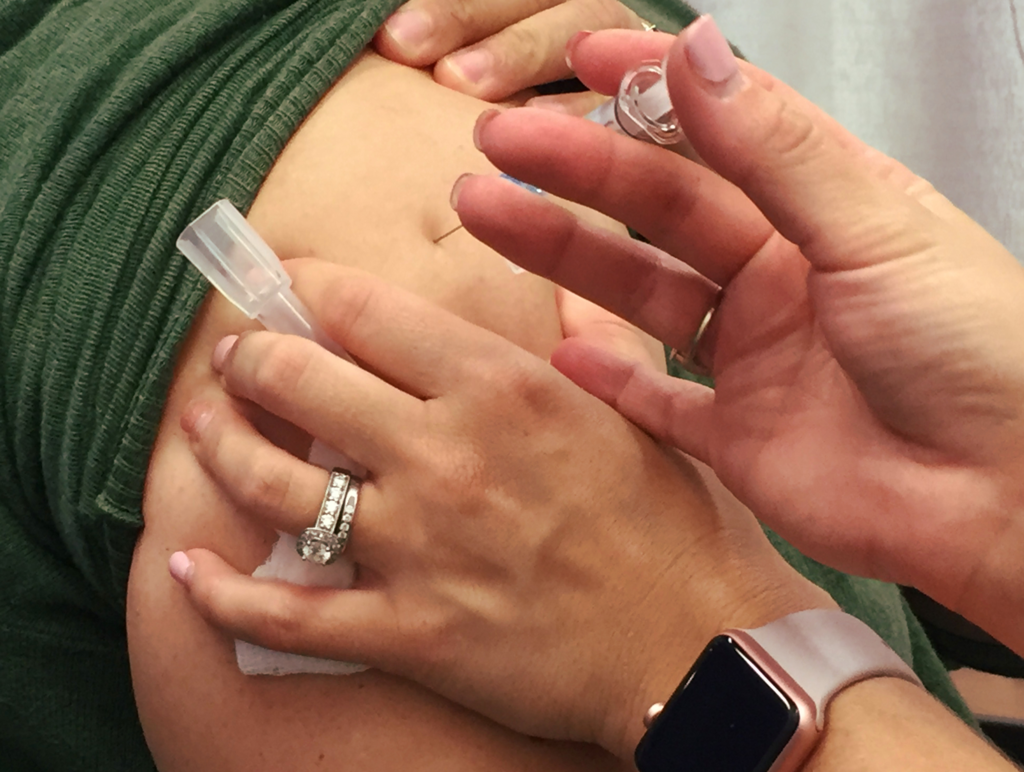
Although there are no plans to include vaccination or virus variant data on the dashboard, this information is available through the CDC. The ACHD hopes that by showcasing current trends, it will encourage more residents to get vaccinated.
Looking ahead, the county is considering expanding the dashboard to track additional diseases. It already has separate dashboards for HIV, sexually transmitted diseases and other infectious diseases, with plans to update those regularly.
For now, the department wants to hear what you think.
“We are interested in feedback from users,” Mertz said, “to get an idea of what additions they think would be useful.”


