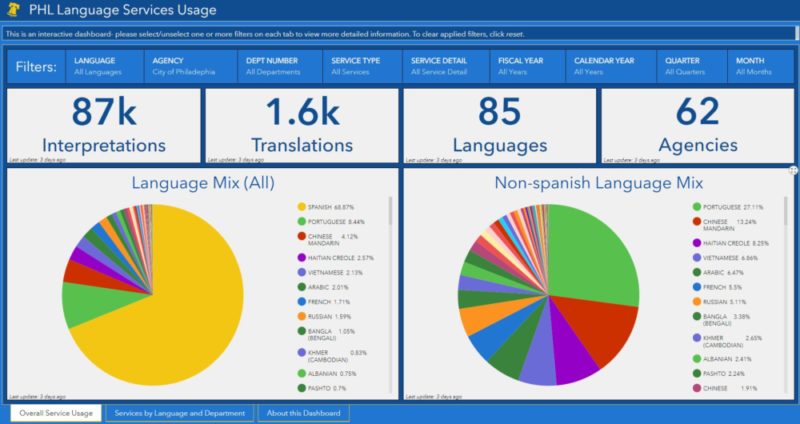
Philly is made up of people who speak many different languages — 85, at least. The City of Philadelphia released a tool this week to help residents better understand the breakdown of these languages.
The digital Language Services Usage dashboard comes through the Office of Immigrant Affairs (OIA). Maria Giraldo-Gallo, OIA’s language access program manager, said the dashboard is a way to increase transparency and accountability of the office’s Language Access Philly program. She already collects data on what language services are provided to each city department, and this dashboard creates a more streamlined way to access that data.
“This was a first attempt of our office to ease the process of communicating to the public and to anyone interested in this data set [and] what’s happening in the Language Access Program,” she told Technical.ly. “By doing an interactive dashboard, people can see and community members can see what have been the languages in which city employees have requested translation and interpretation.”
See the dashboardThe dashboard organizes gov employees’ requests for language services by department and by language. For example, the Department of Public Health may work with some languages more than Parks and Recreation based on the specific communities they work with, Giraldo-Gallo said.
The dashboard is a summary of all these requests over the last fiscal year, July 1, 2021, through June 30, 2022. Since she keeps track of these requests, Giraldo-Gallo will update the dashboard at the end of each fiscal year with the newest set of data.
The dashboard allows users to filter through it by city offices or by language. For example, you can see how many Spanish translation services were completed in the city last year.
“We also have a pie chart with the Spanish distribution, and another without it, so excluding Spanish,” she said, about the city’s most commonly used non-English language. (Nearly 70% of services requested are for Spanish.) “You can also see more of the diversity that we have in our city in terms of languages.”
One note is that these translation and interpretation services are done through third-party contractors. The interactions included in the data set are only the paid services completed by these contractors. If a city employee were to translate something for their office, that wouldn’t be included in the data.
This project was a collaboration between OIA and the CityGeo team within the Office of Innovation and Technology over the last five months. Giraldo-Gallo said her role was to provide the data and explain what it meant to the CityGeo team, who built the actual dashboard.
This dashboard will hopefully help city agencies plan for their language access budgets going forward and also help them understand what the gaps might be in terms of language access within their department, the program manager said. It is also a way to see which offices interact with which languages the most, and identify language trends in Philly.
Giraldo-Gallo noted, too, that the City of Philadelphia is trying to move away from the concept of “top languages” and providing all the resources to those specific languages.
“We want to give equal priority to languages and explain that we understand how complex it is to identify and engage with communities, and these need to be continuously assessed because we have migrants coming, or we could have certain languages emerging,” she said. “Hopefully this can give more nuance to the language landscape in our city.”
Sarah Huffman is a 2022-2024 corps member for Report for America, an initiative of The Groundtruth Project that pairs young journalists with local newsrooms. This position is supported by the Lenfest Institute for Journalism.Before you go...
Please consider supporting Technical.ly to keep our independent journalism strong. Unlike most business-focused media outlets, we don’t have a paywall. Instead, we count on your personal and organizational support.
3 ways to support our work:- Contribute to the Journalism Fund. Charitable giving ensures our information remains free and accessible for residents to discover workforce programs and entrepreneurship pathways. This includes philanthropic grants and individual tax-deductible donations from readers like you.
- Use our Preferred Partners. Our directory of vetted providers offers high-quality recommendations for services our readers need, and each referral supports our journalism.
- Use our services. If you need entrepreneurs and tech leaders to buy your services, are seeking technologists to hire or want more professionals to know about your ecosystem, Technical.ly has the biggest and most engaged audience in the mid-Atlantic. We help companies tell their stories and answer big questions to meet and serve our community.
Join our growing Slack community
Join 5,000 tech professionals and entrepreneurs in our community Slack today!

The person charged in the UnitedHealthcare CEO shooting had a ton of tech connections

From rejection to innovation: How I built a tool to beat AI hiring algorithms at their own game

Where are the country’s most vibrant tech and startup communities?


