
Want to save money on rent? Don’t live off the 2-3 line.
So at least would be a lesson from the fine content folks over at Renthop, who released a map earlier this week showing median rent by subway stop.
“This year, we’ve seen rents dropping across most of Manhattan Island while prices in the outer boroughs and Upper Manhattan rise due to what appears to be a migration in search of bigger apartments and/or cheaper rents,” the rentals and roommates company wrote.
Here’s a hi-res version of the map:
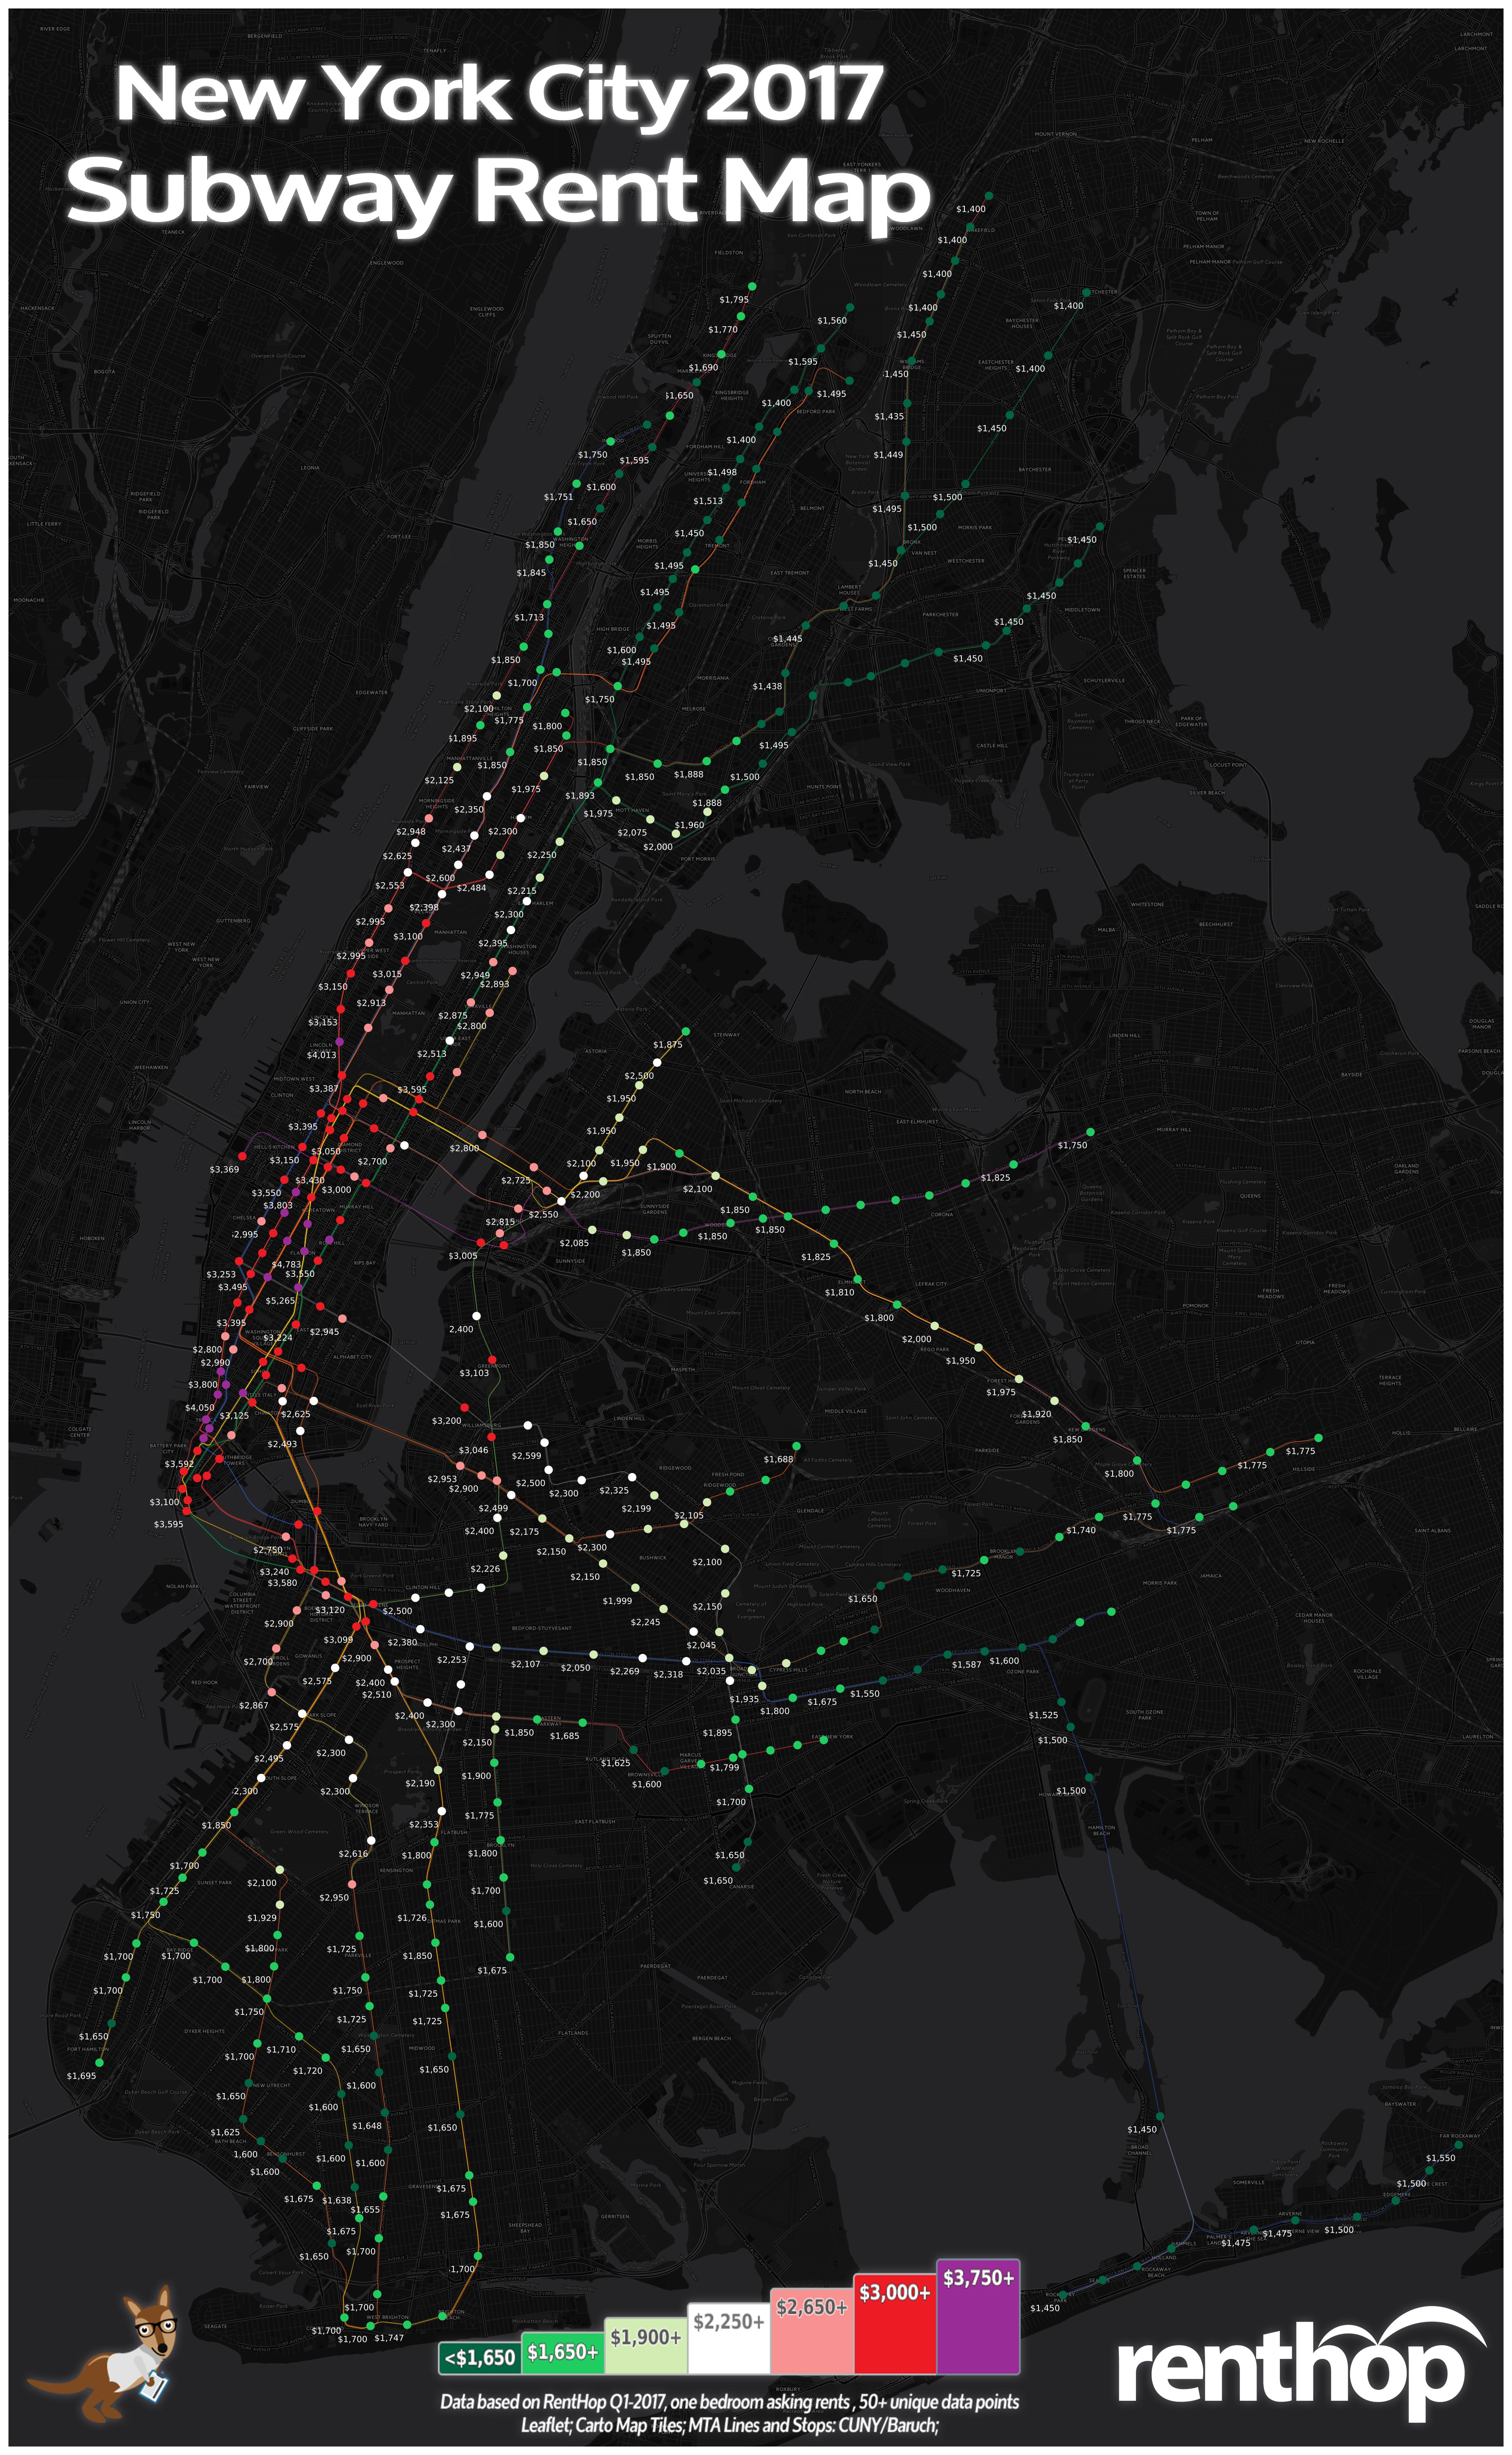
Renthop’s subway rent map.
As you might expect, stations with the most connections command the highest rents, typically, although single-station L and G line stops give them a run for their money.
Here are the year over year price changes in Brooklyn’s three busiest stations, according to Renthop:
- Fulton St (A,C,J,Z,2,3,4,5 Trains) – $3,346 (-0.2% YoY)
- Atlantic Ave – Barclays Center (2,3,4,5,B,D,N,R,Q) – $3,040 (+13.4% YoY)
- Broadway Junction (A,C,J,L,Z) – $2,035 (+16.3% YoY)
We wonder if the new ferry stations will have an impact on the rent calculus in the next year.
Join our growing Slack community
Join 5,000 tech professionals and entrepreneurs in our community Slack today!
Donate to the Journalism Fund
Your support powers our independent journalism. Unlike most business-media outlets, we don’t have a paywall. Instead, we count on your personal and organizational contributions.