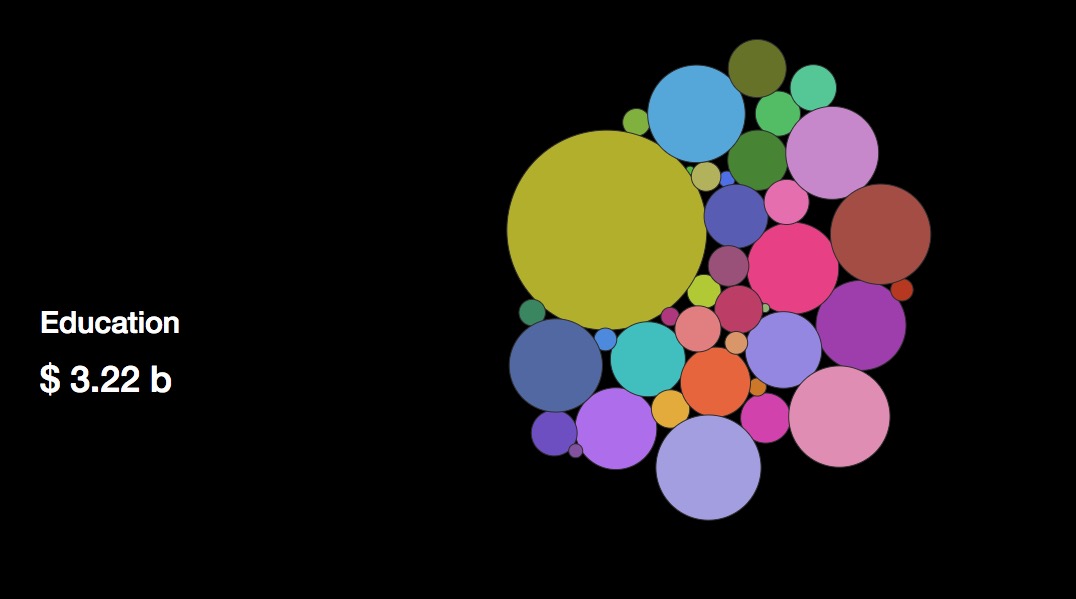
What does the city spend money on? Well, as it turns out, probably the stuff you think it does: education, highway bridges, sewers.
Brooklyn data guru Chris Whong made a lil data visualization of the budget and put it online. Unlike the budget itself, it’s simple and fun to look at. Each bubble on the screen is scaled to its portion of the capital budget. Scrolling over the bubbles will tell you what they are and how much money has been apportioned for them. There’s also a list of every department or project on the right, and scrolling over the titles there will highlight the corresponding bubble. Have fun!
And if you’re into creative FY2017 NYC capital budget projects, check out this one, by Sam Sandberg, which is a whole website with random line items from the capital budget.
Before you go...
Please consider supporting Technical.ly to keep our independent journalism strong. Unlike most business-focused media outlets, we don’t have a paywall. Instead, we count on your personal and organizational support.
3 ways to support our work:- Contribute to the Journalism Fund. Charitable giving ensures our information remains free and accessible for residents to discover workforce programs and entrepreneurship pathways. This includes philanthropic grants and individual tax-deductible donations from readers like you.
- Use our Preferred Partners. Our directory of vetted providers offers high-quality recommendations for services our readers need, and each referral supports our journalism.
- Use our services. If you need entrepreneurs and tech leaders to buy your services, are seeking technologists to hire or want more professionals to know about your ecosystem, Technical.ly has the biggest and most engaged audience in the mid-Atlantic. We help companies tell their stories and answer big questions to meet and serve our community.

Join our growing Slack community
Join 5,000 tech professionals and entrepreneurs in our community Slack today!