What do economic indicators tell us about which areas of the country are thriving, and which are less fortunate? There’s a new rabbit hole for lovers of this kind of data:
The Economic Innovation Group (EIG), a bipartisan public policy organization with a focus on an inclusive American economy, recently released Distressed Communities Index (DCI) interactive map.
This map allows you to follow guided stories of economic conditions in different communities around the US. You can explore the mapped data on various levels — by state, congressional district, county, city and zip code — and the tool will highlight economic disparities, especially as you zoom in past the county level.
To identify how distressed or not a given area is, the index starts with seven economic indicators:
- No high school diploma
- Poverty rate
- Adults not working
- Housing vacancy rate
- Median income ratio
- Change in employment
- Change in establishments
This info is used to create a single measure that puts communities on one of five tiers: prosperous, comfortable, mid-tier, at risk and distressed.
While the guided stories are well done and worth checking out, we wanted to know what the data says about Delaware.
Comfort and disparity
According to EIG’s data, 3% of Delaware’s population lives in a distressed zip code, and 22% of the population lives in a prosperous zip code. For comparison, 15.6% of the US population lives in a distressed zip code and 24.4% lives in a prosperous zip code.
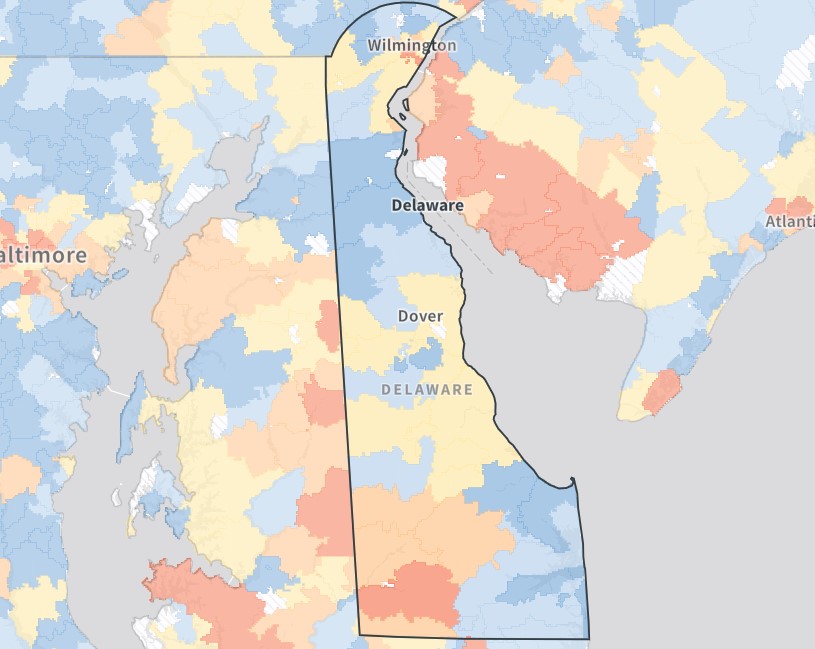
If you guessed that the map shows Wilmington as distressed — and specifically the 19801 zip code — you would be correct. But there’s also a significantly larger (at least geographically) distressed zip code in rural Sussex County: 19956, or Laurel. The demographics of 19801 and 19956 are nearly racially flipped: 19801 is 72% Black and 16% white and about 7% Latino, while 19956 is 69% white, 19% black and 9% Latino.

Delaware Distressed Communitoes index by zip code. (Red is distressed, blue is prosperous) (Screenshot)
In 19956, just 15% of residents have a college degree, compared to 23% in 19801. But the median income ratio — the average percentage of the US median income a household earns — is significantly lower in 19801, at 44%, compared to 77% in 19956. The poverty rate in 19956, at about 21%, is also lower than 19801’s 27%. Both zip codes have a rate of adults not working of around 27%.
These two zip codes are the only ones in Delaware that are ranked in the distressed zone.
Much of Kent County, including Dover, is mid-tier or comfortable. The Middletown area is prosperous, as are the beach towns north and south of Rehoboth and Dewey, which both rank comfortable. Newark is squarely mid-tier, while the rest of Wilmington is a patchwork of all of the rankings. The northern suburbs, including Pike Creek, Hockessin and Talleyville, rank prosperous.
The largest at-risk area in Delaware is the cluster of the 19973, 19947 and 19933 zip codes, a relatively diverse rural area that includes Georgetown, Bridgeville and Seaford. The next largest is 19805, which includes Elsmere and parts of West Side Wilmington.
Pulling back and seeing less
On the county level, it’s easy to see how large income disparity can muddy the data on a broader level:
Both New Castle and Sussex Counties, the two counties with distressed areas on the zip code level, appear as prosperous, while Kent County, which showed no distressed zip codes but fewer prosperous ones, appears a level lower, as comfortable.
Similarly, the congressional district — which is the entire state — ranks comfortable, in line with the bordering Pennsylvania districts, and above New Jersey’s at-risk 02 district and Maryland’s mid-tier 01 district.

Delaware Distressed Communitoes index by congressional district. (Screenshot)
Overall, Delaware has the 8th smallest percentage of population living in a distressed zip code, up there with Minnesota, Vermont and Wyoming, all of which trail the index’s most prosperous state, Utah, with just 0.4% of its population living in a distressed zip code (one of those zip codes being the Uintah and Ouray Reservation).
Delaware comes in as the 34th most prosperous based on zip codes, right between Rhode Island and Hawaii. When you combine the prosperous and comfortable zip codes, however, Delaware is one of just about a dozen states where more than half of the population is at least comfortable.
Join our growing Slack community
Join 5,000 tech professionals and entrepreneurs in our community Slack today!
Donate to the Journalism Fund
Your support powers our independent journalism. Unlike most business-media outlets, we don’t have a paywall. Instead, we count on your personal and organizational contributions.


