Most everyone in Wilmington has heard of CompStat, the performance management system that is credited, at least partially, for the drop in violent crimes in the city in 2018.
Few seem to know what it actually is, beyond that thing that’s been getting good press.
Wilmington Police Chief Robert Tracy knows what CompStat — which stands for “comparison statistics” — is better than most. He helped create it in New York City, and used it in Chicago before coming to Wilmington and implementing it there.
So, is CompStat tech? Is it data? Is it a philosophy?
It’s a little bit of all three. To put it very simply, it’s a system that uses crime data as part of a law enforcement program that focuses on transparency, community outreach and accountability.
For Tracy, though, it’s not about cold, hard data.
“Every piece of data is a person,” he says. “It’s a family affected by crime. We don’t look at it as fighting crime with data.”
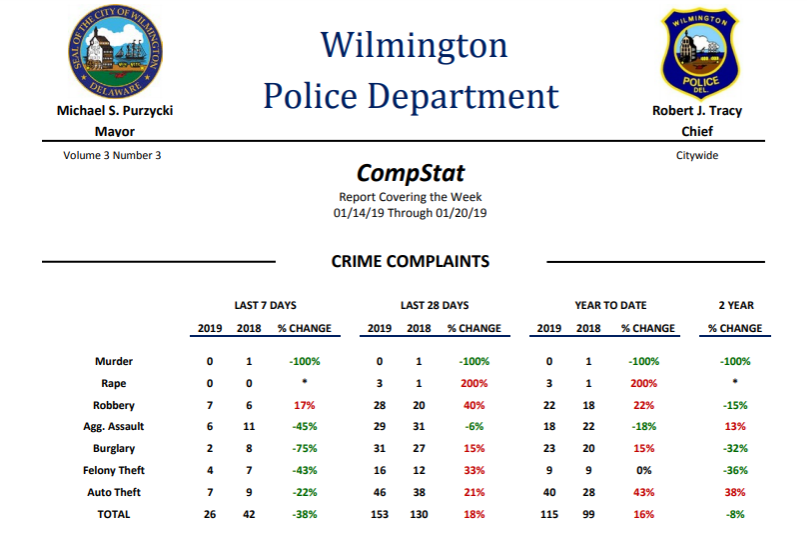
In practice, data collection is essential, though not central, to CompStat. What is the data, exactly? Crime incidents, which the city complies into a weekly report, which is made available to the public:

With a quick look, you can get a general idea of crime trends. You want to see a lot of green, or numbers that are lower than the previous time period. For this period, you can see that, overall, there was an 8 percent drop in crime over two years — but there are also troubling numbers where crime is up from 2018. Less broad are the seven-day numbers, representing incidents that have occurred over that week. Here, those numbers show a 38 percent drop compared to 2018.
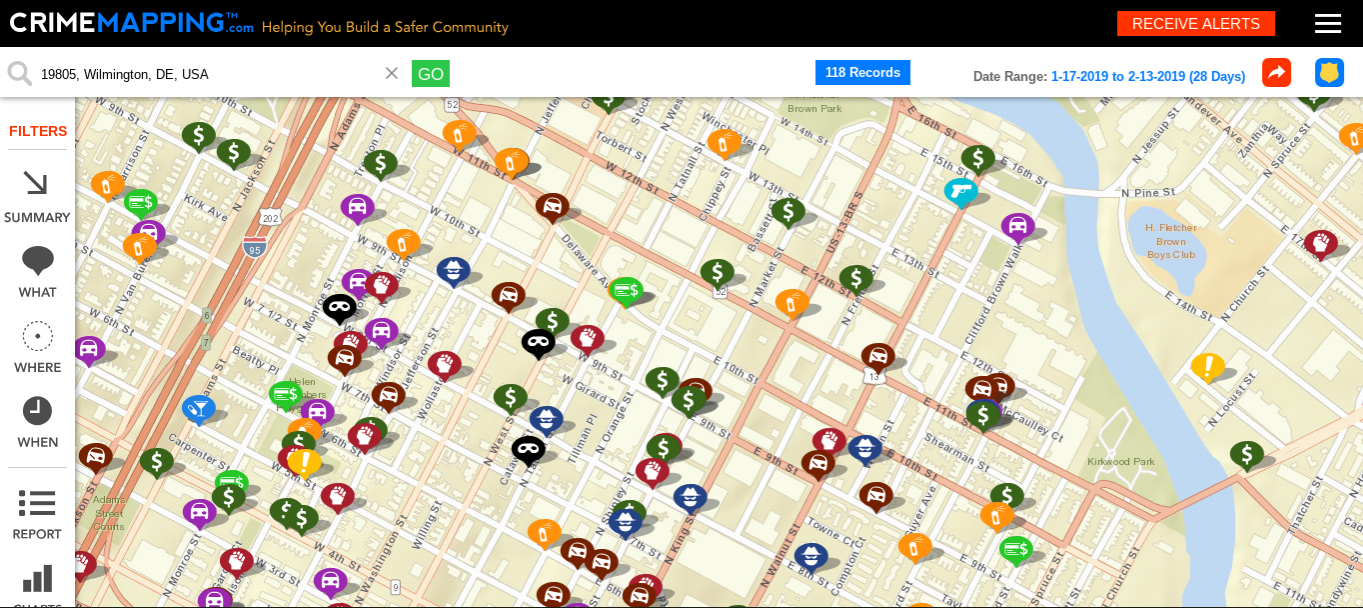
These reports are coupled with crime mapping, which shows incidents on a map:

You can see the location of incidents over a specified time period: Above is a four-week period in downtown Wilmington. During this time, common crimes included larceny, theft from auto/auto theft and property crime. When you click on an incident, you will see additional information — for example, if the incident was shoplifting, if it was a domestic incident, etc.
CompStat itself is sometimes referred to as a crime mapping tool, but that’s not accurate. It uses crime mapping as one of the components of a system of police performance management.
It’s also not a pre-crime program or a data crunching system. The majority of CompStat has less to do with tech and numbers, and more to do with outreach and officer accountability — those real people and not numbers, as Tracy stressed.
For example, Tracy said it’s important that officers become a part of the community of the neighborhood where they are assigned. “Officers attend as many community meetings as possible,” he said.
And then there is what a Police Executive Research Forum report calls “relentless follow-up,” which goes hand-in-hand with accountability. So, if a violent crime happens in a neighborhood, the expectation is that officers don’t just report it and move on. They are held to this with regular CompStat meetings, where leadership questions the effectiveness of an officer’s handling of incidents.
These meetings are not without controversy, as some say they have been used, in some jurisdictions, as a tool of punishment for officers who did not take certain actions or reduce certain crime numbers significantly enough in their districts, as described in a 2017 USA Today column:
“The NYPD says CompStat was the driving force in reducing crime by 75% in about 20 years. Unfortunately, as with many new toys, those who used it found a way to break it. Instead of police departments developing it into a tool that could better control crime, they weaponized it. It was and is wielded as a tool of punishment, embarrassment and coercion. The foot was never taken off the gas, even in light of record drops in crime.”
Overall, CompStat is a method that focuses on solving problems in communities through working with community members directly — and ideally, the data is just a small piece that, on its own, isn’t what reduces crime.


