Recessions – typically defined as two consecutive quarters of declining economic output – are always painful in terms of how they affect our economic well-being. Like all bad things, fortunately, they eventually end and a recovery begins.
But not all recoveries or recessions look the same. And economists have a tendency to compare their varying paths with letters of the alphabet.
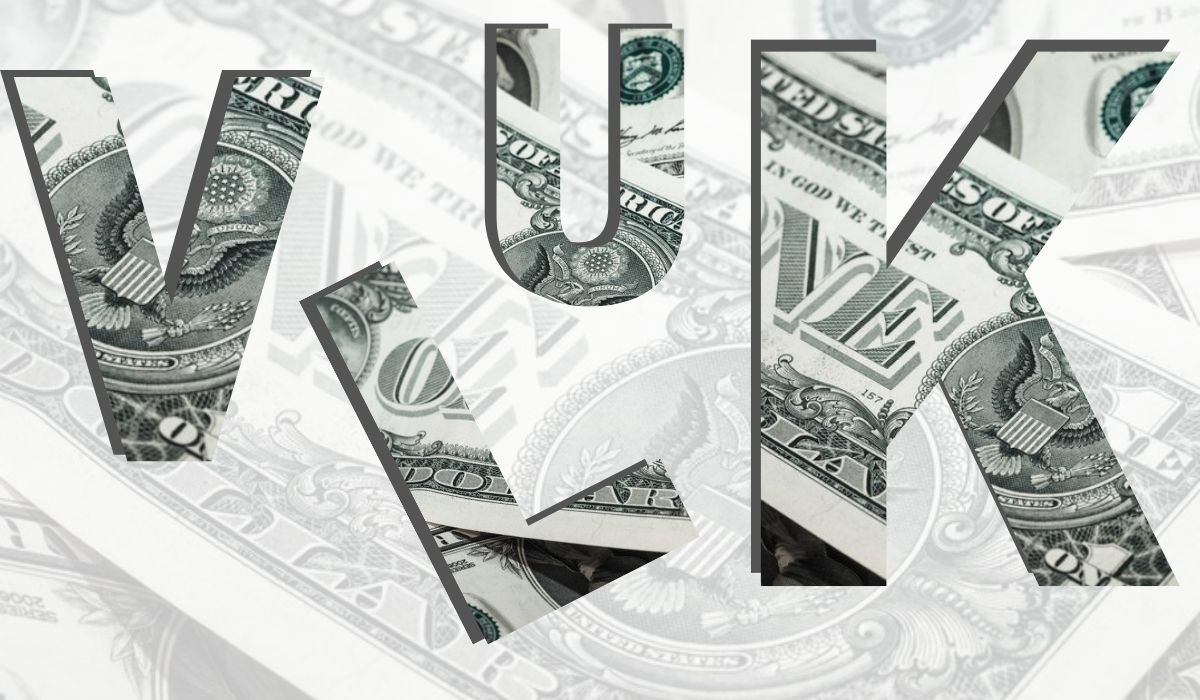
For example, during the current situation, you may have the heard the direction the recovery might take compared with a “V,” a “W” or even a “K.”
As a macroeconomist, I know this alphabet soup can be confusing for a lay reader. So here’s a guide to some of the most commonly used letters.
‘V’ for victory
While recessions are never a good thing, the “V-shaped” recovery is deemed the best-case scenario. In a recession with a V shape, the decline is rapid, but so is the recovery.
A good example of this type of recession took place in 1981 and 1982. That recession occurred after then-Federal Reserve Chair Paul Volcker rapidly raised interest rates beginning in 1979 in an effort to curb high inflation. This caused a sharp recession – leading to what was then the highest unemployment rate in the U.S. since the Great Depression.
But outside of economic circles, this recession is little remembered. Why? Primarily because the recovery was so rapid. After Volcker began cutting interest rates in the second half of 1982, the economy entered a recovery as sharp as the recession.
‘U’ and a long bottom
Conversely, a “U-shaped” recession generally has a longer duration, both for the downturn and the recovery period. The 2001 recession that followed the dot-com bubble and the 9/11 attacks fits into this category.
In some ways, the post-dot-com recession was a mild one. The fall in employment from the job market’s peak in February 2001 until the trough in August 2003 was only slightly less than 2%. Yet it took over two years of decline for the economy to bottom out, and it took another year and a half for the number of jobs to exceed the pre-recession peak. Furthermore, the amount of time spent near the bottom of the recession was relatively long.
The reclining ‘L’
The last U.S. recession, which coincided with the financial crisis of 2008, was especially brutal.
Economists call it an “L-shaped” recession because there was an initial sharp downturn, but a very plodding recovery. To see the L, you need to imagine the letter sort of reclining backward on its end.
The economy declined rapidly after the September 2008 failure of Lehman Brothers, and employment plunged about 6.3% from its pre-recession peak before reaching its low point. The pace of job creation in the recovery was very slow. It took almost 4½ years to recover all the jobs lost.
‘K’ and a two-track recovery
It may be hard to see how a K could be applied to data on a graph, but it’s the letter increasingly being used to describe the path of the current recession and eventual recovery.
Fed Chair Jerome Powell didn’t call it a “K” but that’s basically what he meant when he discussed the current economic trajectory in a recent address. He expressed concerns that the U.S. will experience a “two-track recovery” in which things get better quickly for some people, while staying bad for others.
Is that the kind of recession we’re in?
It’s unclear. So far, looking at the whole economy, the U.S. has what has been called a “checkmark” or “swoosh” recession. It began to look something like a V, with a sharp drop in employment and then the beginnings of a rapid increase. But that recovery has begun to stall – though not for everyone.
As Powell suggested, the recovery could look different to various groups. White-collar workers may see a “V,” as their jobs are more capable of being done remotely. Blue-collar workers are seeing something closer to a U or L. One analysis shows that medium- to high-wage workers have gained back virtually all the jobs lost during the shutdown earlier this near. Conversely, employment of lower-wage workers is still more than 20% below its pre-COVID-19 peak.
Recessions are tough for anyone to live through. However, the shape of the recovery can make it more or less bearable.![]()


