
Authors’ note: This article is a preview of the 2023 C&S Compensation Survey Results. It is not the final product. You can volunteer to review our drafts by joining the C&S chat community, joining the #team–survey channel, and volunteering to review in a message to the channel. You can also email surveys@codeandsupply.co with questions and offers to help our volunteer team who engages in this effort to improve the tech community through knowledge sharing.
Code & Supply, an international community of software professionals based in Pittsburgh, will soon release our independently conducted 2023 compensation survey report. The below report is a snapshot of tech workers’ compensation and lifestyle.
The survey collected data from more than 750 technology professionals, including 527 in Pennsylvania. It covers topics such as salary, benefits and job satisfaction. The report highlights the increasing demand for tech talent in the Pittsburgh region and beyond, and the growing importance of skills like cloud computing, data analysis and software engineering.
Making an impact
Many Technical.ly readers who are also Code & Supply members may be familiar with our 2017 and 2020 compensation surveys and the blog posts that served as the project’s primary summary reports. There were many tangible and intangible outcomes resulting from the survey findings. Some of these outcomes included greater transparency into the software and tech job market in the Pittsburgh area, increased knowledge-based leverage capability during job negotiations, and a desire to dig deeper into how software and tech folks are compensated. Community members reported anecdotally that the data here has been instrumental to their salary negotiation.
This is precisely our intention of the survey and the report: to equip the community with knowledge to make better decisions about their career, especially when it comes to compensation for their time and work. This is what Code & Supply is about: building software, community, and friendships that enable all of us to be happy with our work and life as software professionals.
Past surveys
The first survey effort emerged from conversations during C&S Build Night and spontaneous coworking sessions in Pittsburgh in late 2016. Launched in 2017, the inaugural C&S Compensation Survey was largely a one-person effort with input from dozens of C&S members. More than 250 people, mostly C&S Slack members, responded. The report was limited to a pair of blog posts.
After some false starts in the intervening years, finally, in January 2020, we initiated the Compensation Survey Working Group. We launched the survey collection drive coincident with the onset of the COVID-19 pandemic in the United States. We had 785 valid responses and produced a 107-page report. In 2022, we launched again, but with a clearer long-term vision, a more focused set of questions, and the intent to build a reusable and mostly automated analysis pipeline for our 781 valid responses.
The 2017 survey analysis pipeline was a collection of Ruby scripts that generated tables imported into Apple Numbers to create graphs. This was a mostly unrepeatable process. In 2020, we used Tableau to generate the graphs. We found this was still a mostly manual process that was not easily automated or shared among our authors. While many readers expressed appreciation for the in-depth report, the resounding advice was that 107 pages was daunting to read despite the wealth of information inside.
For 2022, we committed to the content of the survey questions for the long term after reducing the number of questions asked to focus our analysis on the sections our readers felt most relevant to them. Keeping the data easily compared from survey to survey became an architectural value of the project. We built the graphs and analysis tooling as an internal data pipeline product developed primarily in Python with tools like Plotly for graphs and Polars for data manipulation. We are interested in doing more with location data related to where participants live and work, commutes, and any effect or impact on job satisfaction. We also aimed to keep the report shorter than 2020’s 107 pages, reducing the time commitment from a whole day to an afternoon or evening.
Foundational results
The compensation section includes the foundational results of the survey. We received responses from 35 different job titles, and most were professions related to software development, software engineering, and product management. As could be expected of those participating in a compensation survey distributed by a community focused on software engineering, 61% (476) of respondents reported their job title as an engineer. However, we did try to represent the results of those who are not software engineers or developers.
The last survey was taken in 2020, which was a time of instability and unpredictable factors.
The COVID-19 pandemic has profoundly impacted the job market, particularly for tech workers. As companies worldwide were forced to adapt to remote work, many tech workers were in high demand as businesses scrambled to transition to a digital-first approach. However, as the pandemic and the “great resignation” continue, the job market for tech workers has become increasingly complex and competitive.
The great resignation has created a challenging job market for tech workers. While many job openings are still available, there is also fierce competition for those positions, especially with many tech companies announcing layoffs for 2023.
Despite the economic uncertainty caused by the pandemic, the tech industry continued to grow. In fact, according to the Bureau of Labor Statistics, the tech sector added 91,000 jobs in the first quarter of 2021 alone. The demand for tech talent was so high that some companies offered unprecedented perks and benefits to attract and retain employees.
However, as the pandemic has dragged on, many tech workers have become increasingly burnt out and disillusioned. The “great resignation” trend, in which employees are leaving their jobs in record numbers, has hit the tech industry particularly hard.
There are a number of factors driving the great resignation in tech. Media reports indicated many workers reported having been forced to work longer hours and take on heavier workloads during the pandemic, leading to burnout and fatigue. Others have reevaluated their priorities and decided they want a better work-life balance, more fulfilling work, or higher pay. The rise of remote work has also made it easier for workers to search for jobs outside their local area, increasing the competition for talent.
The great resignation has created a challenging job market for tech workers. While many job openings are still available, there is also fierce competition for those positions, especially with many tech companies announcing layoffs for 2023. To stand out in the crowded job market, tech workers may need to focus on developing in-demand skills, building their professional network, and crafting a strong personal brand.
[Authors’ note: Remember, this survey was conducted before the mass layoffs of Q4 2022 and Q1 2023 at Meta, Amazon, Microsoft, Twitter, and other sizable employers of those toward whom our survey is oriented.]
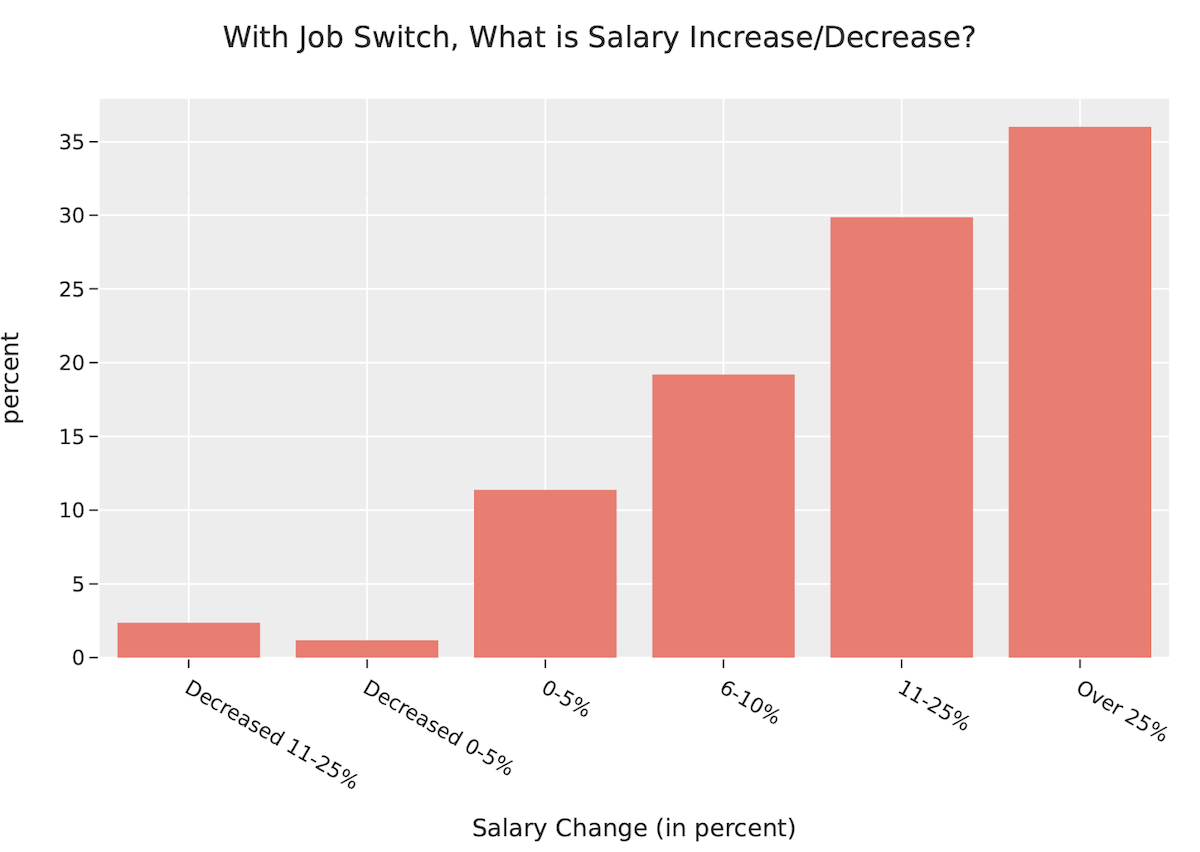
By the time we distributed the survey in the summer of 2022, the job market had generally settled. However, we did ask about job changes and respective salary jumps.
It appears that salary changes and job switches are common occurrences for many respondents. Interestingly, a significant portion of respondents (12%) received raises that were 5% or less, while 19% had raises in the range of 6-10%. This suggests that while some employees may see small increases in salary, others may see more substantial changes. Additionally, it confirms typical advice that job switching can lead to larger salary increases, as 65% of respondents who switched jobs saw raises of more than 11%. This could indicate that some employees may be more likely to switch jobs to achieve higher salaries rather than relying on raises within their current position.
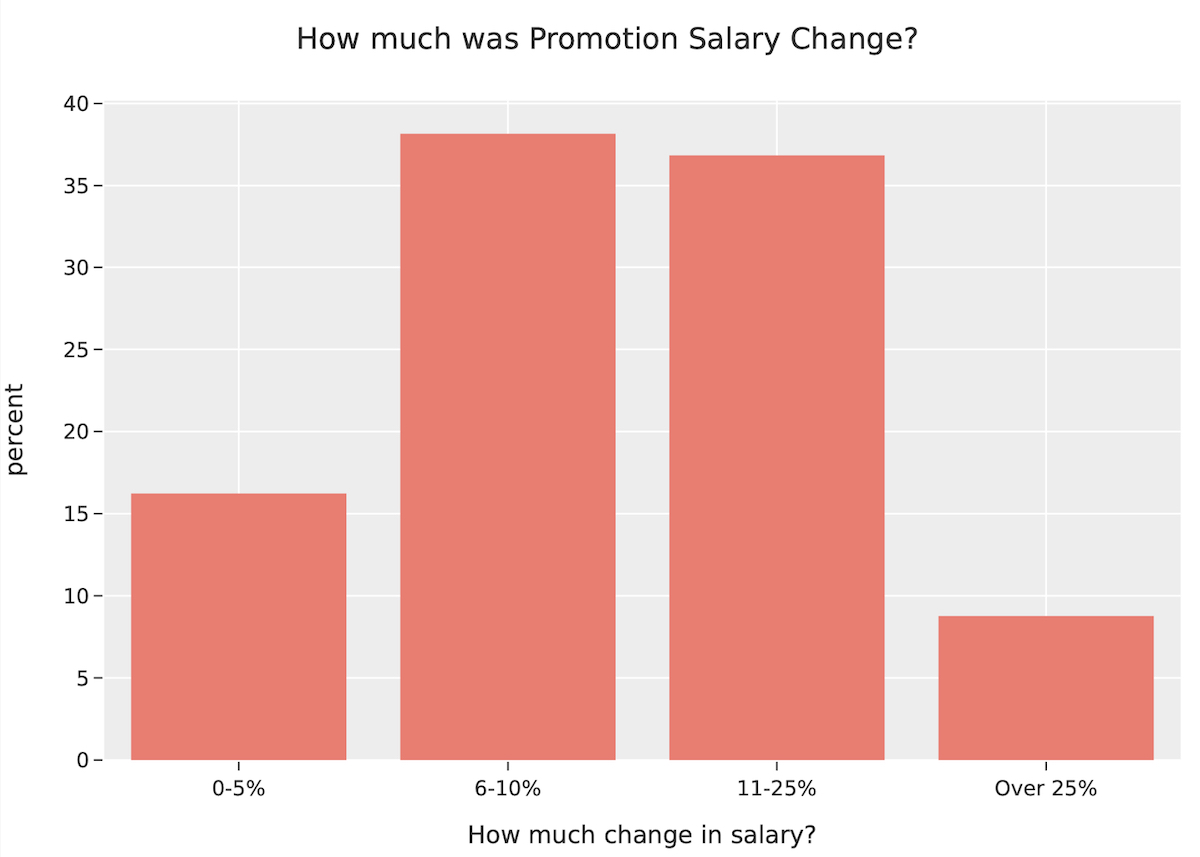
Based on the provided data in the question “How Much was Promotion Salary Change?” it appears that promotion salary changes can vary significantly for respondents. It is interesting to note that a majority of respondents (38%) received raises in the range of 6-10% following a promotion, while a significant portion (36%) saw even larger increases in the range of 11-25%. This suggests that promotions can lead to substantial salary changes for many employees.
However, it is also notable that a small percentage of respondents (16%) received raises of less than 5%, indicating that not all promotions lead to significant salary increases. It is possible that these individuals may have received promotions with added responsibilities but without a corresponding increase in pay, or they may have been promoted to a position with a lower pay range than their previous position.
Overall, the data suggests that promotions can be a valuable tool for increasing one’s salary, but the actual amount of the raise may vary depending on a range of factors, like tenure at the company, budget, and the type of company. We’d like to explore this further.
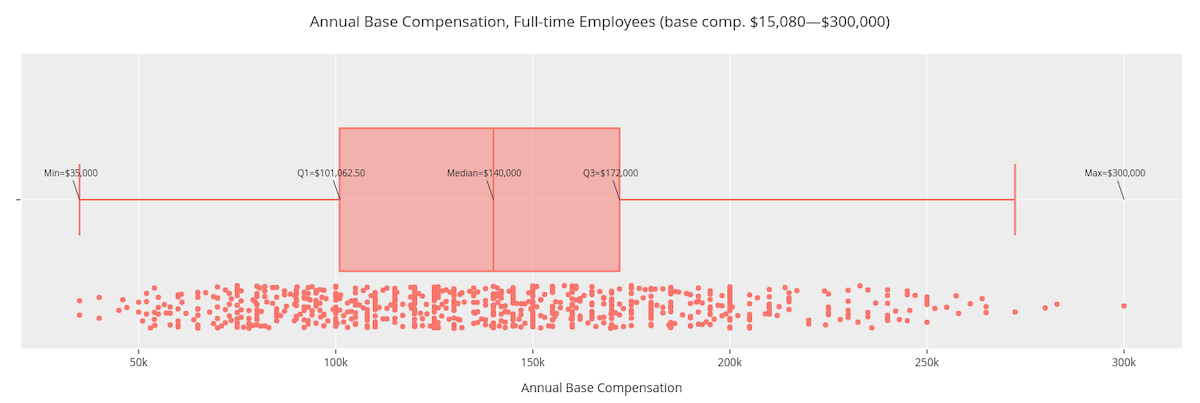
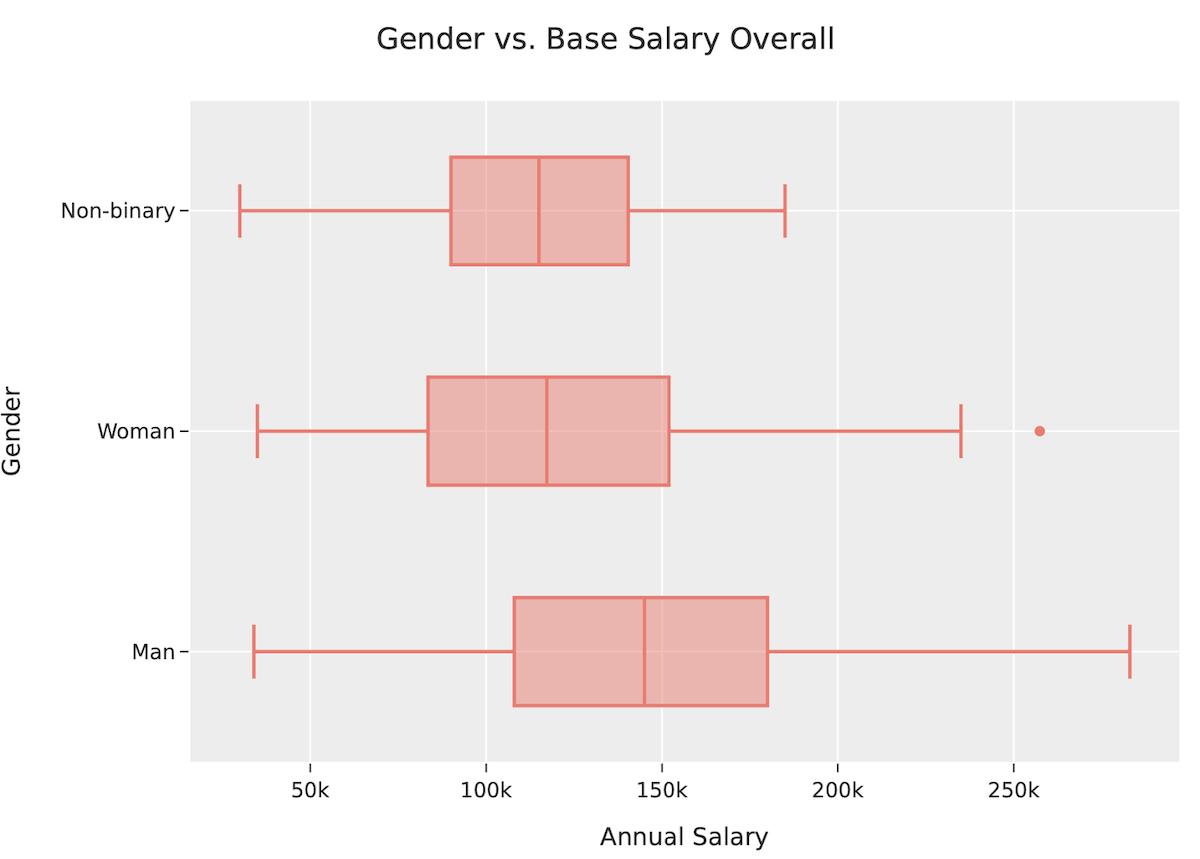
The data in “Total Base Compensation” — salary or other regular, recurring wages — indicates that there is a significant range in salary changes for tech workers, with a base compensation for Q1 at approximately $101,000, a median of $140,000, and a Q3 of $172,000, with the lowest reporting being $35,000. This suggests that while some tech workers may earn salaries that are relatively modest, others are highly compensated for their work.
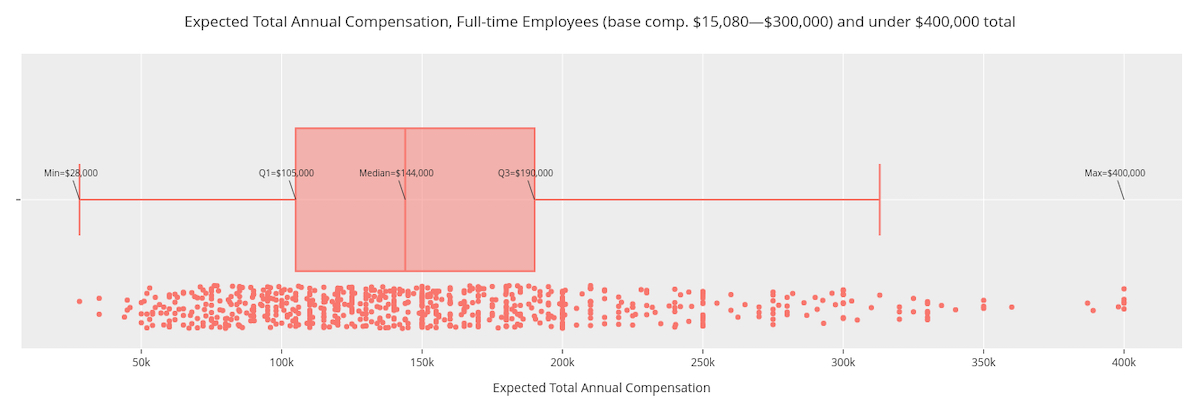
Overall, we found that the full-time median total compensation was $150,000 for engineers.
Overall, we found that the full-time median total compensation was $150,000 for engineers and about $120,000 for non-engineers, and the minimum total compensation was $28,000 for engineers and $44,000 for non-engineers. Total compensation includes base compensation and significant other expected payments like merit and profit-sharing bonuses, equity in the form of stock options or stock grants, retirement contributions, and other perquisites that the respondent considered a part of their compensation package. This suggests that while engineering roles may offer higher salaries on average, there may also be a wider range of compensation for these roles. The difference in minimum compensation could be attributed to factors such as experience, education and location.
Overall, this data suggests that engineering roles may offer higher compensation than non-engineering roles, but it is important to consider factors such as experience and location when analyzing compensation trends. Additionally, the wider range of compensation for engineering roles highlights the importance of negotiating fair salaries and benefits, regardless of industry or role.
This next graph reflects the base compensation for all full-time respondents reporting $300,000 or less, which was around 98% of respondents.
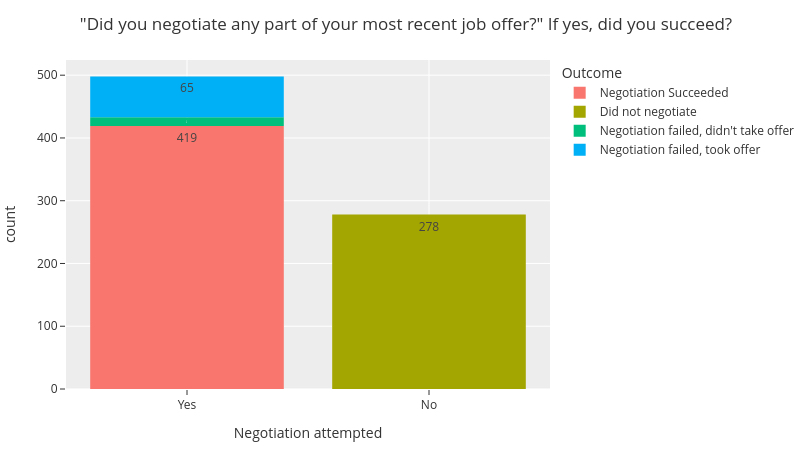
We found that over half of our respondents negotiated their most recent job offer, and most of those were successful. This goes to show that if you are hesitant to negotiate, you should try because your about-to-be-new employer is likely prepared for it.
Over half of our respondents negotiated their most recent job offer, and most of those were successful.
Negotiating a salary in the tech industry can have numerous benefits for workers. Firstly, it can help ensure that they are paid fairly and in line with industry standards. This can be especially important in the fast-paced and rapidly-evolving tech industry, where skills and experience can quickly become outdated. A negotiated salary can also help employees feel valued and motivated, leading to increased job satisfaction and productivity. Additionally, negotiating a salary can set the stage for future negotiations and career advancement opportunities.
There is no evidence to suggest that tech workers with higher salaries are more likely to be laid off. In fact, many companies may prioritize retaining highly skilled and experienced employees, which may include those with higher salaries. However, it is important to note that economic conditions and company-specific factors can impact job security for all workers, regardless of their salary. Therefore, while negotiating a salary can provide numerous benefits, it is also important for workers to remain aware of broader economic and industry trends and to continue to build and improve their skills and experience.
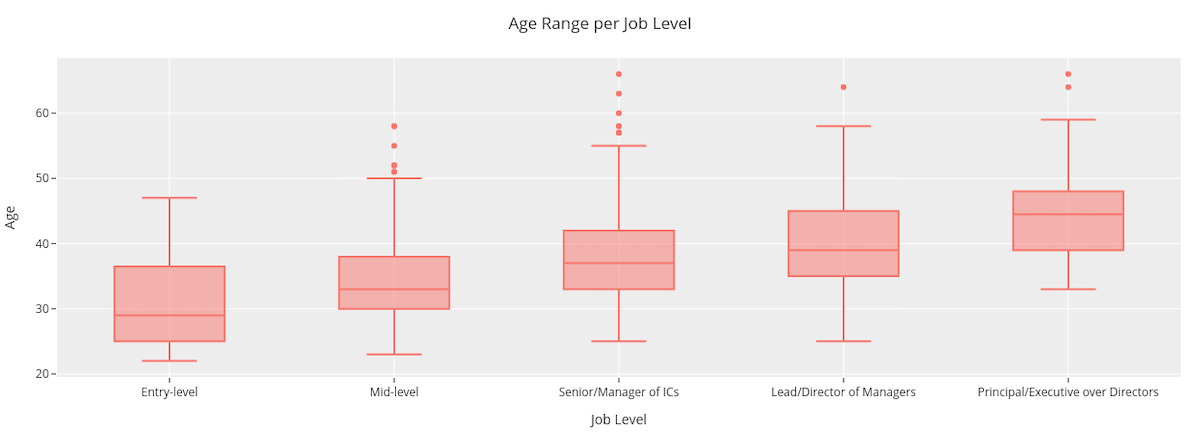
We also looked at the age range for job level. Predictably, older people held more senior roles. The box and whiskers (excluding outliers which are visible) graph displays the age range per job level across various positions in the industry.
For entry-level positions, the age range is between 21 to 49, while mid-level positions have an age range of 22-50. The senior and lead positions have a wider age range, from 25-55. Finally, for the most experienced and high-ranking positions such as Principal, the age range is between 32-59. This data provides valuable insight into the age demographics of each job level, which can inform career planning and recruitment strategies. It is also worth noting that these age ranges are not necessarily fixed and may vary depending on the industry and individual company practices.

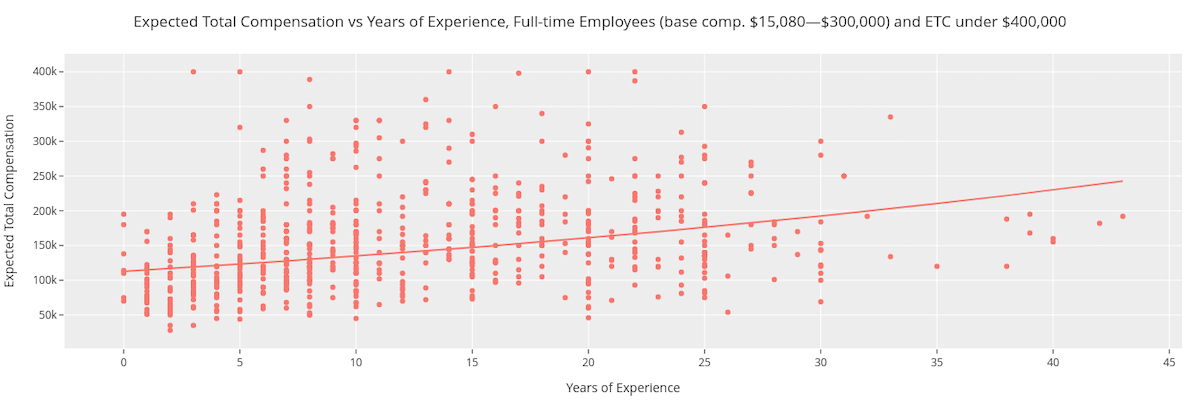
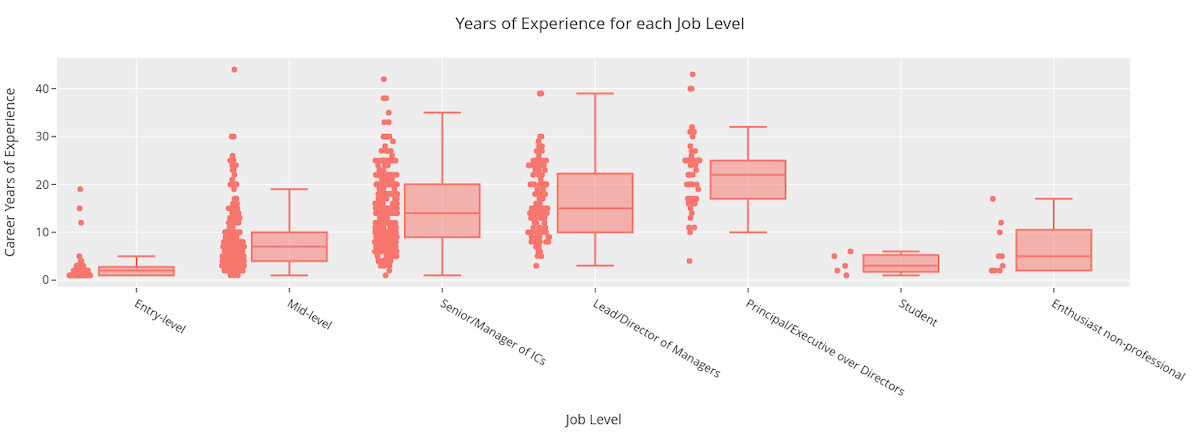
We asked respondents about their experience levels and years of experience in the tech industry. It’s not uncommon for individuals to transition to a career in tech from another field, and many newcomers are eager to know when they will be considered “senior” or “principal.”
Our findings revealed that the majority of entry-level individuals in tech have around five years of experience. The first quartile for those in a “senior” position is at nine years, with the second quartile at around twenty years. Lead and Principal positions were slightly higher, with quartiles offset by 1-2 years. These results indicate that the number of years of experience in tech correlates with job level, with seniority typically achieved after around nine years of experience. However, it’s important to note that individual circumstances and skill sets may vary, and career progression is not solely dependent on years of experience.
Overall, this data can serve as a useful benchmark for those seeking to understand the typical career trajectory in the tech industry and the years of experience typically required for various job levels. In the full report, we plan to analyze this with age.
While the preliminary findings are intriguing, the full report is expected to provide more detailed insights and analysis, which will be released in the spring. We would love to hear your suggestions of what to analyze; email yvette@codeandsupply.co.


