
Harnessing the power of data can help you decide where to open a business, buy a home, apply for a job, direct public services or target your marketing — and it’s never been easier in Baltimore.
The Baltimore Economy Dashboard is a new tool from the Baltimore Development Corporation, the city’s nonprofit economic development agency. A one-stop resource for the latest housing, job market, finance, population and business trends, it aggregates 43 data points into easy-to-use, understandable snapshots of the local economy.
The dashboard was inspired by a conversation BDC President and CEO Colin Tarbert had with economic development leaders in Phoenix and Tampa, Fla.
“I think it was last June when I learned that they were working on this,” Tarbert told Technical.ly., “and I said ‘Oh, wow, this would be great for Baltimore to have as well.’”
A year later, the project is live, thanks to support from Bloomberg Associates. The consulting arm of the charitable foundation run by New York billionaire and philanthropist Michael Bloomberg, it managed and paid for development of the site.
“Bloomberg Associates was kind enough to say ‘We can work with Baltimore to create a dashboard for you as well,’” Tarbert said. “They’ve tailored it a little bit to some of the data metrics that we would want to see that’s also very similar to the other two cities that they helped build a dashboard for.”
Public-facing consoles like these are a rising trend in cities around the US.
Boston aggregates a slew of city services data into one health “score” that updates daily. Pittsburgh has a site that provides an “index” for four downtown metrics: vibrancy, economy, safety and cleanliness. Phoenix and Tampa’s tools launched earlier this year. Baltimore’s went live on June 11.
It was built by Neighborhood Nexus, a regional information systems firm based in Atlanta, under the direction of Nikolai Elneser, the org’s community impact officer. Chicago-based consulting firm Assemblage provided the full stack application development.
Elneser was also responsible for the overall web design of the platform.
“What it gives is an up-to-date, very comprehensive data dashboard that will give you many variables in the same place, and will therefore make decisions easier and faster,” Elneser said, adding that the dashboard is also accessible on mobile devices. “I think there’s a lot of value in the scope and range of data that is published.”
Insights on six key areas, with info that updates quarterly
To decide what to feature on the dashboard, the Neighborhood Nexus team conducted research and held conversations with city officials.
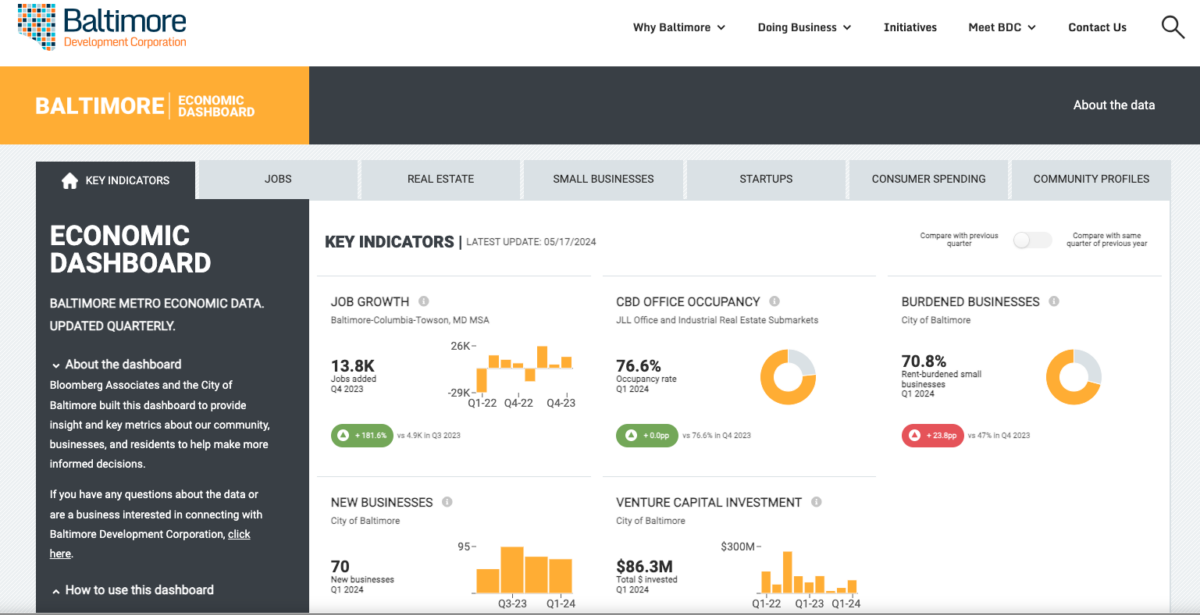
They landed on indicators that cover six economic areas: jobs, workforce, real estate, small businesses, startups and consumer spending, using data from nine public and private sources.
Some of the numbers, such as those pulled from the US Census Bureau’s American Community Survey or the Bureau of Labor Statistics, can be accessed by anyone. Others, like workforce data from Lightcast, are only available with a paid subscription.
That’s valuable on its own, but likely the biggest service the dashboard provides is presenting all that information in easily digestible formats. There are maps that let you visualize how consumer spending varies by neighborhood, or see where households are most cost-burdened by rent. Charts let you compare stats like venture capital investment or unemployment rates to the previous quarter or the same quarter last year.
Key to the whole thing is that it’s programmed to automatically update every quarter, with no manual data entry required.
While the dashboard will likely foster a diverse audience, the tool is particularly useful for economic planners, real estate investors and entrepreneurs, BDC President Tarbert emphasized. He doesn’t foresee any major changes to it in the near future.
BDC’s relationship with Bloomberg Associates dates back about four years, Tarbert said, when he was involved in discussions with the firm’s economic development team about Baltimore’s response to the COVID pandemic.
Bloomberg has since partnered with BDC on a range of topics and initiatives, including the Baltimore Together Summit, which going forward will be informed by the new tool.
Over the dashboard’s first month of operation, the engagement and reception have been mostly favorable, according to Tarbert.
“The feedback has been positive,” Tarbert said. “People are happy that this information is accessible, and that it’s also easy to understand.”
Updated July 20 to clarify consulting firm Assemblage did full stack application development for the dashboard.


