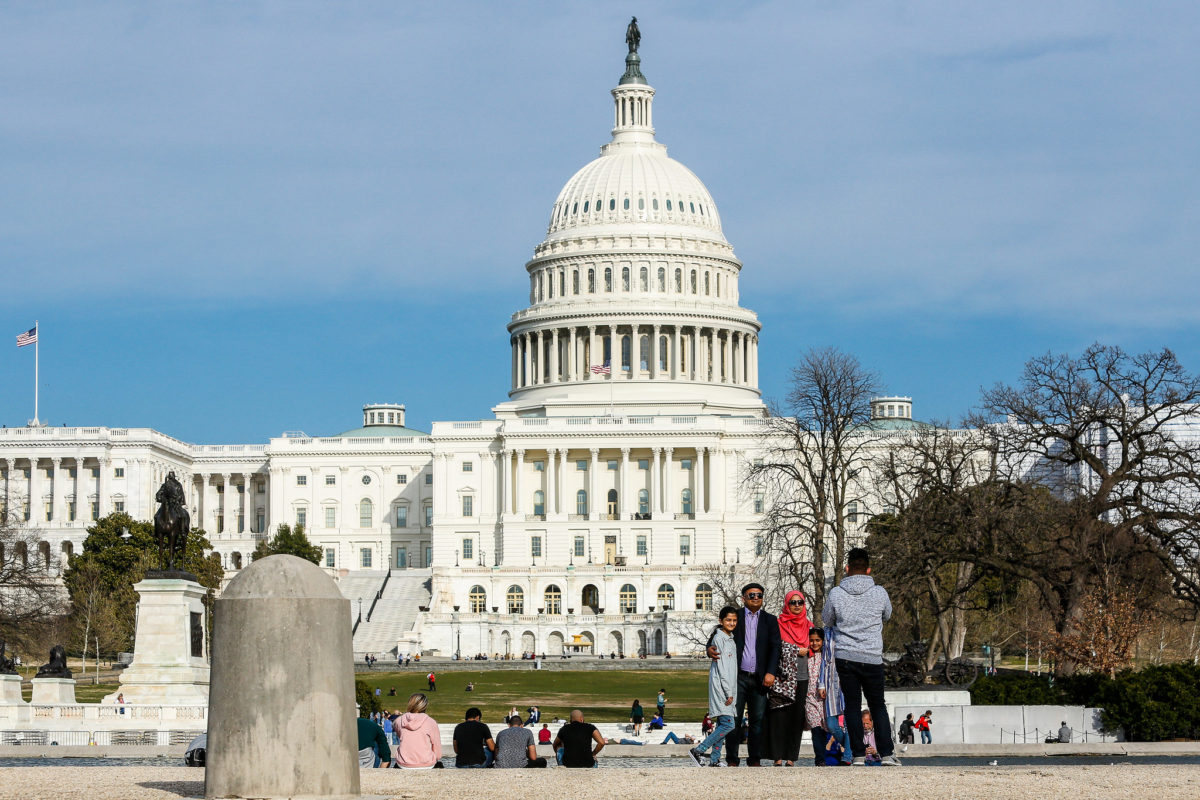
Nearly 30% of all businesses in the District are Black-owned — the largest percentage compared to four other major U.S. cities, according to a new report.
The report published in mid-August by Philly’s Center City District (CCD) and the Central Philadelphia Development Corporation examines the business density in five East Coast cities — Philadelphia, New York, Atlanta, Boston and Washington, D.C. — while highlighting and comparing how many Black-owned businesses are in these regions.
The report draws data from the U.S. Census Bureau’s annual business survey in 2018 and its American Community Survey 2017 one-year estimates. It’s important to note that there are large differences in geographical size and population among the five cities, so the report shows a “business density” for each city, which is the ratio between the number of businesses in a city and its population. The 2018 business data used was the most up-to-date information available.
Technical.ly Philly reporter Paige Gross took a deep dive highlighting the stats in Philly, which has fewer Black-owned businesses than the other four major cities. Philadelphia reportedly had the lowest number of firms overall when compared to its population, and it also had the lowest number of Black-owned businesses when compared to the amount of its Black residents.
Though there are still disparities between the number of Black-owned and white-owned businesses across the U.S., D.C. is doing better than most in trying to close this gap. Based on the District’s 2017 population of 693,972 residents — 318,220 of which were Black, about 45% — for every 1,000 residents, there are five Black-owned businesses, 7.8 Hispanic-owned businesses, 60.8 Asian-owned businesses and 29.8 white-owned businesses.
“The higher the ratio of firms to residents, the more potential opportunity should exist within the boundaries of the city,” the report says.
Read the full reportHowever, Black-owned businesses in the District also bring in close to the least amount of revenue, with $1.9 million in sales in 2017. White-owned business brought in $3.1 million, Hispanic-owned businesses brought in $2.9 million and Asian-owned businesses made $1.6 million — though Black-owned businesses in D.C. made the most when compared to the other four cities in the report, bringing in between $600,00 to $1 million more. (While it wasn’t the focus of the report, note the huge disparity between revenue and number of Asian-owned businesses, too.)
For more information on local business contracting in the District for Black and brown people, check out this annual public report published by the Department of Small and Local Business Development (DSLBD). DSLBD partners with other government departments to help small business with tax and book-keeping services, credit report, making loan lender connections and more.


