Maps that detail the contours and boundaries of housing discrimination during the Great Depression were among National Geographic’s Best Maps of the Year.
Johns Hopkins historian N.D.B. Connolly was one of the academics behind “Mapping Inequality,” according to the JHU Hub, as one of a group of professors from four universities that brought maps from the National Archives online. A team from the University of Maryland’s Digital Curation Innovation Center led by Richard Marciano also played a big role.
See the maps
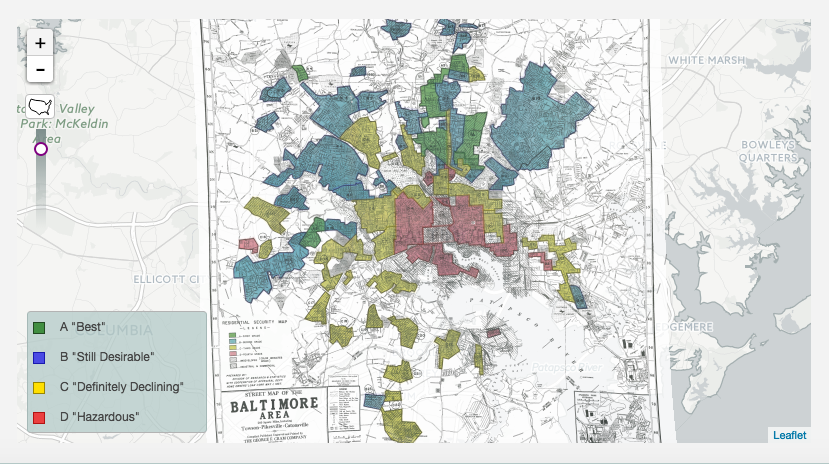
The project collects hundreds of maps from the federal Home Owners’ Loan Corporation, showing redlining in the 1930s in cities like Baltimore. Real estate agents that rated investment risk of a given neighborhood using the presence of ethnic and racial groups among the criteria. This made it very difficult for people in minority neighborhoods to take out loans for a home.
“It’s a troubling legacy that’s now more open to study by academic and amateur historians alike,” National Geographic’s Greg Miller writes.
These maps show Depression-era redlining in Baltimore and other U.S. cities
National Geographic named “Mapping Inequality,” which Johns Hopkins and University of Maryland researchers worked on, one of its “Best Maps of the Year.”