Using data to illuminate the challenges the city is facing is the main point of Baltimore Data Day. At the Baltimore Neighborhood Indicators Alliance-sponsored event’s Civic Tech panel on Friday, a pair of number-crunchers showed how they were looking at the city’s recent crime spike.
Since the rioting that followed the death of Freddie Gray, gun violence has spiked to record levels. May saw the most murders of any Baltimore month since the 1970s. And it hasn’t stopped, with a total of 89 murders happening in the two-and-a-half months since May 1.
No stranger to looking at the data behind local issues with his BmoreMapped project, Civic Tech panelist Ryan J. Smith put together a map that shows per-capita crime stats on the neighborhood level. The map, which Smith said is still in progress, uses police data from OpenBaltimore to break down what types of crimes happen in specific volumes throughout the city, and combined that with Census and neighborhood info. Smith said he hopes to have the map complete by the end of the week.

Use the map
Along with the spike in crime, anecdotal evidence has suggested a dip in arrests by police in the wake of the indictment of six officers in connection with Gray’s death. Smith’s fellow panelist, Justin Elszasz of The Training Set blog, dug into the OpenBaltimore data to find out.
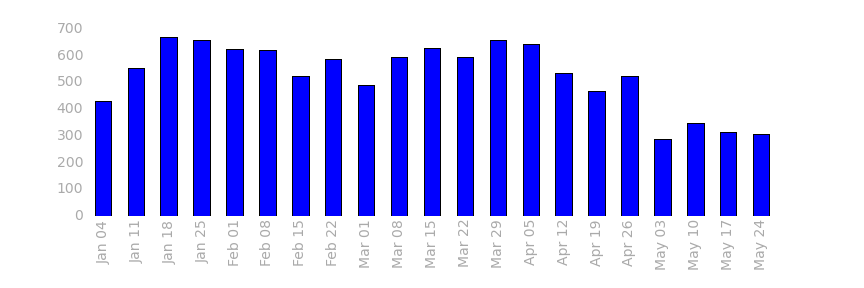
Elszasz, whose looks at parking tickets and vacant houses we have spotlighted in the past, found that arrests between April and May dropped about 40 percent. In April, there were 2,438 arrests, while in April there were 1,449.
“Police Commissioner [Anthony] Batts can dodge or deflect all he wants, but as has been reported, arrests have dropped and the city data corroborate it,” Elszasz wrote in June. Batts, for his part, was fired by Mayor Stephanie Rawlings-Blake last week.
The data behind Baltimore’s crime spike
At Baltimore Data Day, a pair of civic hackers talked about some of their latest work with city crime data.


