Discussions on the diversity of Philly’s tech ecosystem usually dance around observation and anecdotal evidence.
That’s because data on this subject is scarce, at best. We’ve seen companies like Comcast and Dorm Room Fund release actual numbers, but a general look at the whole scene is hard to come by.
Enter San Francisco-based workplace data analytics firm Paysa, which took a stab at putting together some numbers on diversity, or lack thereof, within Philly’s tech workforce. The tidbits of info on our fair city were taken off their national report titled “Diversity opportunities.”
But before we dive in, how did they get them? In other words, are these numbers trustworthy? The company reportedly singled out Philadelphia-relevant data from a pool of 500,000 job postings, 100,000 companies and some 35 million salary data points across the United States.
The company’s research department gave some more insight on how the data was collected:
“Names from relevant Philadelphia resumes were run through two sets of .gov databases (Social Security and Census) in order to identify the following: first name, last name, gender and ethnicity,” the company told Technical.ly in an emailed statement. “Paysa then classified the resulting identifications at various confidence levels. Confidence levels were set at a high threshold for this data scrape (and all Paysa data) so only conclusive results were included in the information we reported to you.”
OK, got it. And now, the numbers:
- Ethnic diversity:
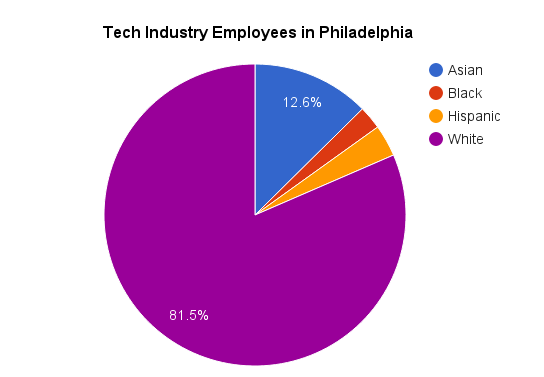
According to Paysa.com, the ethnic makeup of Philly’s tech workers is as follows:

Source: Paysa.com. (Black workers represent 2.5 percent, whereas Hispanic workers came in at 3.4 percent.)
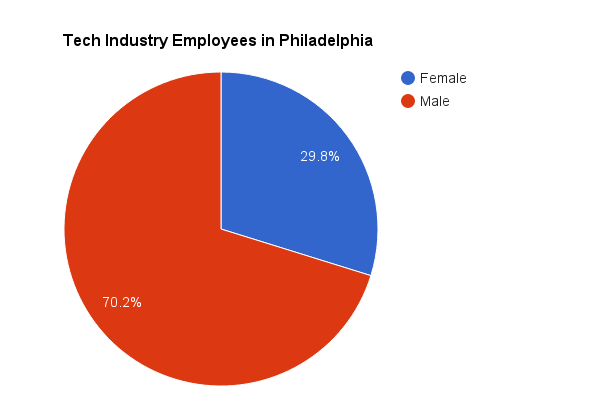
- Gender diversity:

Source: Paysa.com.
Now that you’ve seen the numbers, here are three thoughts:
- This data (broadly) reflects what we already thought: Namely, that tech is a field dominated by white males. To a certain extent, they’re the overarching force in of a lot of rooms where the Philly tech scene gathers (except for that wonderfully multicolor Diversity Dinner).
- This is the kind of data set we need: An honest conversation about diversity challenges needs to be driven by an honest look at the current state of affairs. We’d love to have another report to contrast with this one.
- This is a just snapshot: It’s hard to assess any data without necessary context. And in this case, data from previous years has not been made available. Is the state of diversity actually improving in Philly? Is it getting worse? Both calls would have to be made with previous year’s data in hand.
Leave your thoughts in the comments section. Let’s start a conversation.
Before you go...
Please consider supporting Technical.ly to keep our independent journalism strong. Unlike most business-focused media outlets, we don’t have a paywall. Instead, we count on your personal and organizational support.
Join our growing Slack community
Join 5,000 tech professionals and entrepreneurs in our community Slack today!


