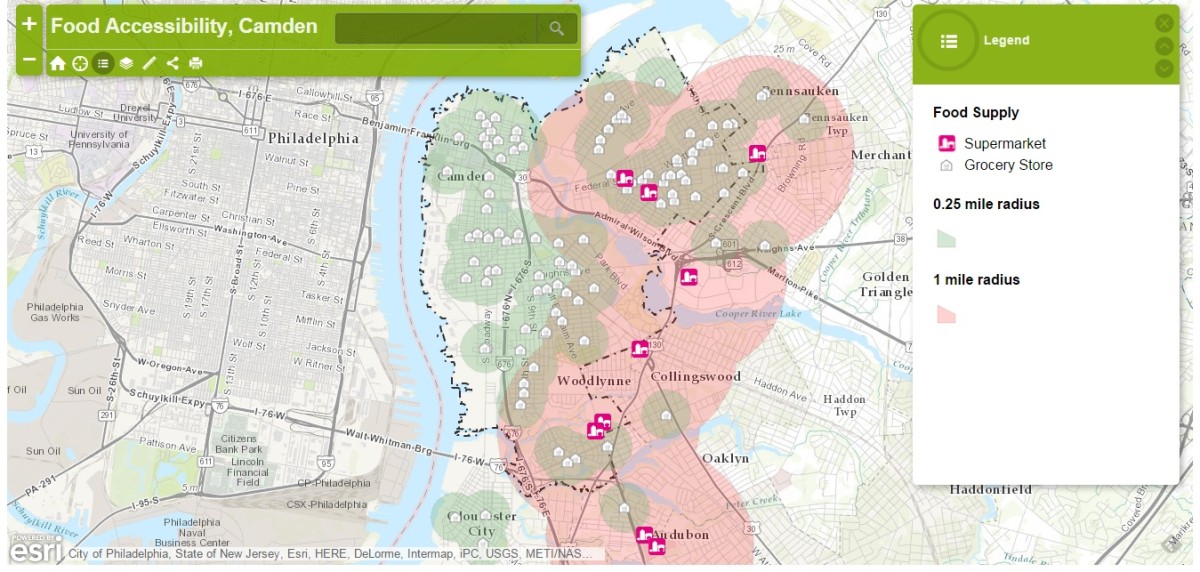
Right across the Delaware River lies a city the USDA has dubbed a “food desert” — a place where the availability of fresh food is critically low. It’s a place where supermarkets are few and far between, and certainly too far to access without a vehicle. Corner stores selling junk food thrive, and bodegas become residents’ primary source of sustenance.
Camden has a serious food accessibility problem.
You don't take action off of an Excel spreadsheet.
But one nonprofit is working to change that. Hopeworks ‘N Camden, based in North Camden, trains at-risk youth ages 14-23 web development, Salesforce and GIS. Hopeworks has its students work on projects for clients — effectively killing two birds with one stone.
“Our goal is not to make a rich guy richer, we don’t need to charge that price,” said Hopeworks ‘N Camden’s Chief Impact Director Dan Rhoton. “The only thing we need our businesses to do is cover the expenses of the youth we employ.”
Recently, Rhoton assigned three youths from a local high school’s after-school program — two 15-year-olds and one 16-year-old — to work with Hopeworks GIS Director Luis Olivieri. Using YellowPages, the team mapped out locations of Camden’s grocery stores, supermarkets, bodegas and corner stores. The result? A map that anyone can use and subsequently realize that Camden is in serious need of fresh food.
See the map
“The quality of the data can be improved,” said Olivieri. ” One store closes and another opens.” Olivieri says the data will be relatively easy to obtain, and that updating the map will be a cakewalk. “We can change the information very easily.”
The team plans on adding population data from the U.S. Census and economic information such as income. “It could be a very powerful map,” Olivieri said. “It is right now. You can see how, most of Camden, the main source of supplies is the bodegas in the area.”
That means food options are limited.
“You can get chips, you can get a hot pocket, maybe an empanada — but you’re not buying healthy, fresh food and you’re paying a premium for what you get,” said Rhoton.
Both he and Olivieri say the map took 4-6 hours for Olivieri and his team of youths to produce. “I hope that map inspires action,” Rhoton said. “You don’t take action off of an Excel spreadsheet.”
Olivieri sums up the power of the map in two sentences.
“Information is power,” he said. “Having a good way to analyze and visualize that information makes it even more powerful.”


