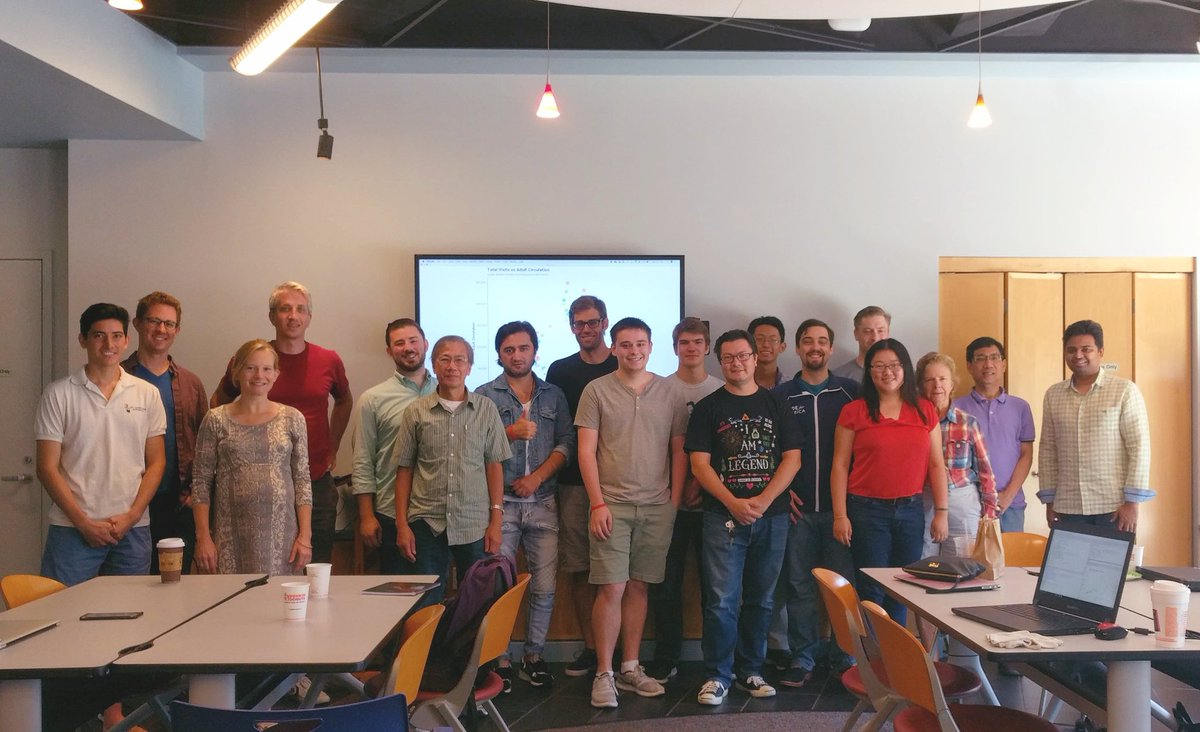
Open Data Delaware’s weekly Code & Coffee, held Saturday mornings at Brandywine Hundred Library, took on a special project for the Sept. 23 National Day of Civic Hacking (NDoCH): The group took the library’s own open data and used it to learn data visualization.
https://twitter.com/opendatade/status/912303230977224704
Data visualization is, simply put, data that is made legible in visual formats. Charts, graphs and especially maps are crucial to civic tech, where raw data needs to be made accessible to the community.
Interested in learning how to do it? Ryan Harrington, Code & Coffee organizer, shared a detailed breakdown of what they learned Saturday on his blog.
https://twitter.com/rharrington31/status/912322325063794688
The next Code & Coffee is this Saturday from 10:00 a.m. to 12:00 p.m., at the regular spot. The free workshops are open to all skill levels — bring your own device and a breakfast item to share.
You can RSVP below.
https://www.meetup.com/Open-Data-Delaware/events/242754257/
Data visualization took center stage at Delaware’s National Day of Civic Hacking event
Open Data Delaware’s Sept. 23 workshop took on a crucial element of making data sing.