From fish fries to COVID-19 infections, Pittsburgh’s open data organization has new findings to share.
The Western Pennsylvania Regional Data Center (WPRDC) published a number of new datasets recently focused on public health, as part of its mission to support research and community engagement via open data.
Supported by the Richard King Mellon Foundation, Heinz Endowments, University of Pittsburgh and more, the center provides comprehensive datasets and visualizations to act as an intermediary in promoting local data literacy. The center works with local government organizations and other institutions to publish data of all kinds, from 311 requests to restaurant inspections to fire incidents.
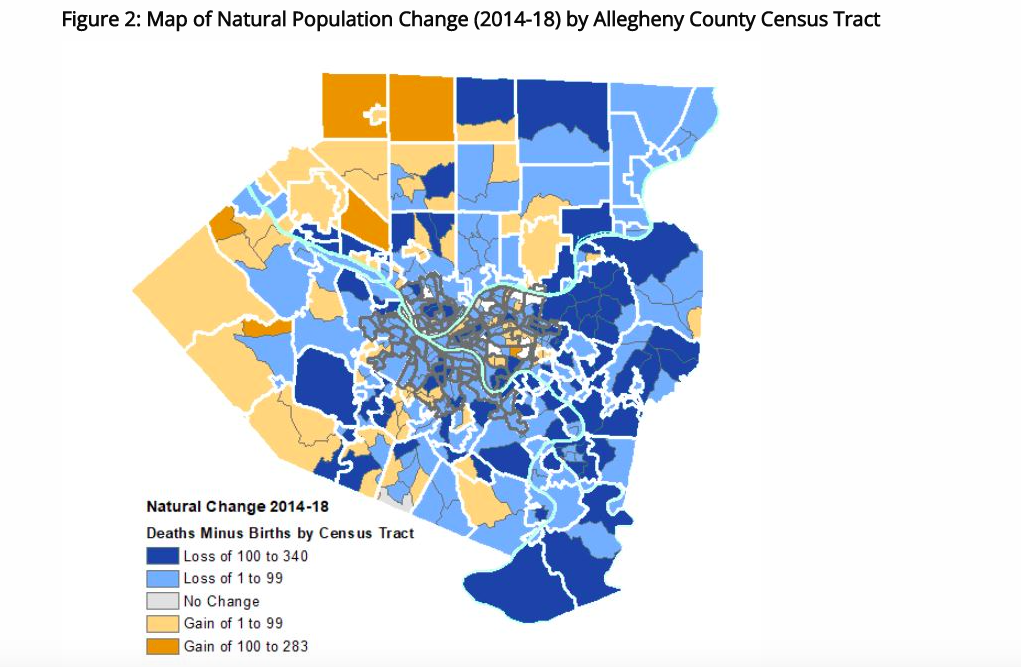
Last month, the most notable sets that became publicly available through the center included vital statistics data for Allegheny County, tracking the number of total births and deaths in the region. Both the birth outcomes data and mortality data have two files each, covering trends at the county level and according to 2010 Census Tract regions. The new sets — which track the incidence of birth outcomes by race, medical insurance, gestation time, birthweight and other factors, and mortality by cause of death, age group and race — paint a clearer picture of the various social determinants of health that exist in the Pittsburgh region.
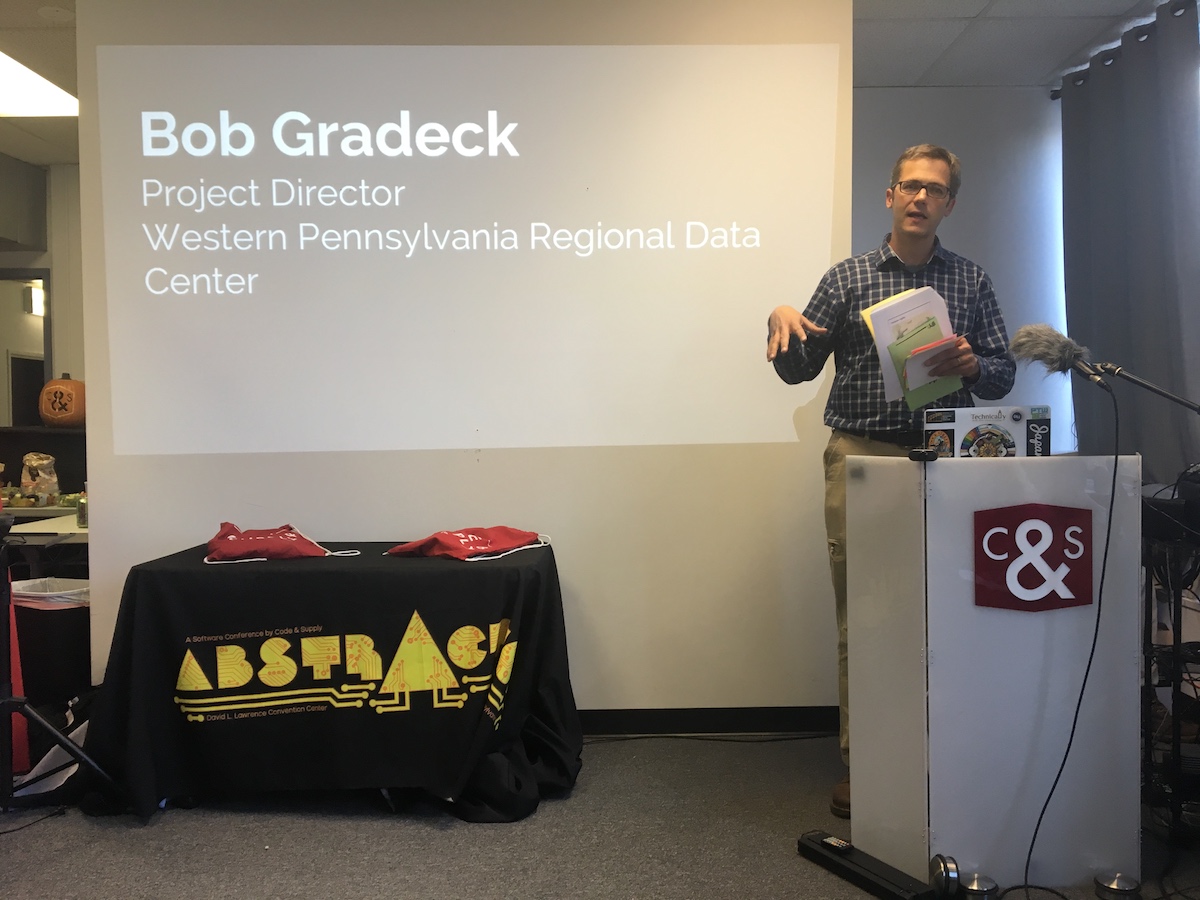
“A lot of the work that goes into making data available is about being part of a lot of different community conversations,” WPRDC Project Director Bob Gradeck told Technical.ly. Many of those have involved discussions of health equity, and of finding ways to make data from civic organizations more accessible and digestible to the everyday Pittsburgher.
The process for getting that data into public hands isn’t complicated, exactly, but it can take time. Gradeck’s team might go to an organization with the data and say, “Here’s the use case, this is what we’re looking for and here’s what we’d like it to include,” he said. In the case of the vital statistics data, the Allegheny County Health Department pulled the data together, then both orgs discussed any potential privacy issues or risks in sharing it. WPRDC processes the file, the county gets it through the approval process — “and then we have the data ready to go.”
[Editor’s note: Check out Technical.ly’s 2018 reporting series Open Data PGH for more on open data trends and the work to track them in Pittsburgh.]

Outside of the vital statistics dataset, Gradeck said the organization has also recently published findings on COVID-19 infections and reinfections in Allegheny County, plumbing inspections and violations and, of course, updates to the annual Lenten fish fry map, updated each year in collaboration with Code for Pittsburgh.
There will be even more in coming weeks, Gradeck said. In continuing to work with the county health department, other datasets from the county’s Housing and Community Environment Program and additional datasets related to the pandemic will soon become available on the WPRDC website.
Mayor Ed Gainey’s new administration, Gradeck added, has also been particularly supportive in bringing more datasets to the public.
“I think a lot of the work that we’ve been doing around structural racism and social determinants of health, they are also very interested in,” he said, noting one of Gainey’s primary campaign platforms to identify the root of inequities in Pittsburgh. “The other thing, too, is that hearing more about how they value data governance as a process and as an important part in managing the city, but also working with everybody that lives in it to understand some of the data that they work with — that’s all encouraging too.”
That support will be important as the WRPDC looks to expand on its own efforts to promote data literacy. Though the pandemic has made it harder to work in-person with different community organizations and help walk people through exactly what a new dataset means, Gradeck said the organization has tried to be more active in its communications across social media and through blog posts detailing key trends and highlights.
Going into 2022, “we’re looking at community literacy and kind of how to interact and make sense of data, how to find data,” he continued. “That’s also going to extend to a lot of the partnerships that we have with nonprofit organizations in the city and in the county as well, in terms of developing workshops that everybody can participate in to understand not only how to structure a spreadsheet, but more about, how we think about power dynamics with data and a lot of the things that kind of go into our definition of data literacy.”


