
Nearly 10 years after DC launched an initiative to reduce traffic deaths, the number of people killed by cars hit a new high.
DC remains far behind its Vision Zero goal to eradicate traffic deaths or serious injuries by 2024, despite introducing technology in recent years aimed at boosting transparency for the city’s residents.
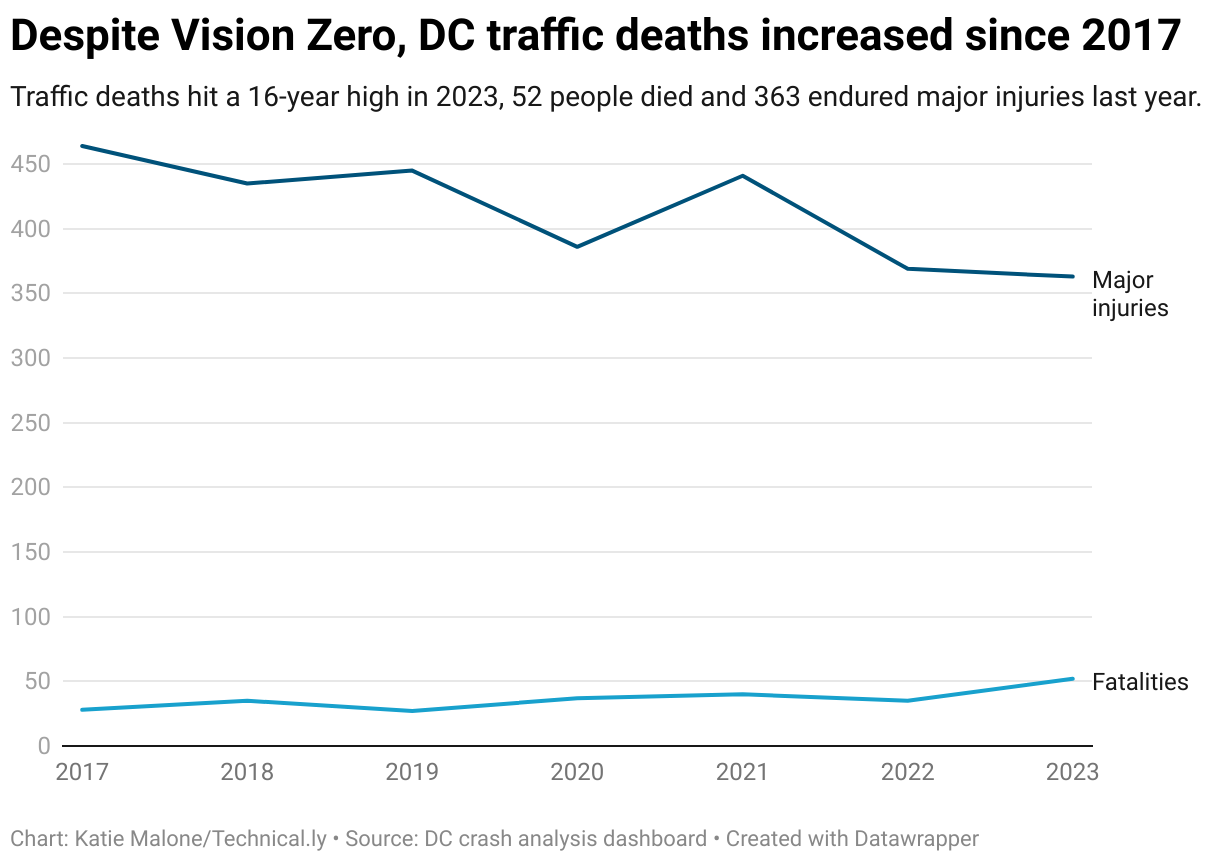
Vision Zero works to eliminate traffic fatalities and severe injuries in different cities across the United States and internationally. DC set 2024 as the goal to fulfill this commitment but is far away from this target. Traffic deaths hit a 16-year high in 2023 — 52 people died and 363 endured major injuries last year, according to DC’s crash dashboard.
“The Vision Zero commitment reflects a philosophical change and a commitment to the idea that every death is a tragedy and that every death is preventable,” said Charlie Willson, who’s the director of Vision Zero under the Office of the Deputy Mayor for Operations and Infrastructure. “So we don’t have all the answers, but we do have a plan.”
As of mid-August, there have been 213 serious injuries and 33 fatalities in 2024, per the dashboard.
In the last few years, the city ramped up speed camera placement and deployed signs detecting if drivers are on their phones. There’s also a dashboard associated with the project tracking car accidents and traffic safety projects.
Automated traffic enforcement still reduces speeding
City data shows that installing a slew of speed cams across the city could be working.
“No one said it would be easy.”
Charlie Willson, Vision Zero Director
DC is continuing to implement the automated traffic enforcement cameras, with a priority on placing them along roads where fatalities and injuries frequently occur, per Willson, the Vision Zero director. There are nearly 500 cameras placed in DC, he said.
There’s also a dashboard for residents to track the locations of these cameras, which was launched earlier in January and is updated daily.
DC also introduced “SmartSign” technology in April, which detects if drivers are on their phones, not wearing a seatbelt or driving too fast. These were placed where crashes occur frequently.
While the city missed the 2024 target, Willson noted the Vision Zero team is taking a data-focused approach to alleviate traffic deaths and injuries.
“No one said [achieving the goal] would be easy,” Willson said.
One of those efforts is through the crash dashboard.
It was released in 2021 and built using Esri, the geographic information system technology company, which has an office in Vienna, Virginia. The DC government also used Esri to build its AI tool for navigating city data, DC Compass, released this spring.
Open data increases awareness about the scale of traffic deaths
Maintaining the dashboard is a twofold process, Kanika Singh, acting manager for the performance management division within the District Department of Transportation (DDOT), explained.
The team at DDOT receives data from the Metropolitan Police Department uploaded to Open Data DC. Then, the IT team at DDOT merges the different data sets to be published on the dashboard, according to Singh.
While the dashboard is updated daily, there’s about a week latency for data related to injuries, per Singh, but a day turnaround for traffic fatality data.
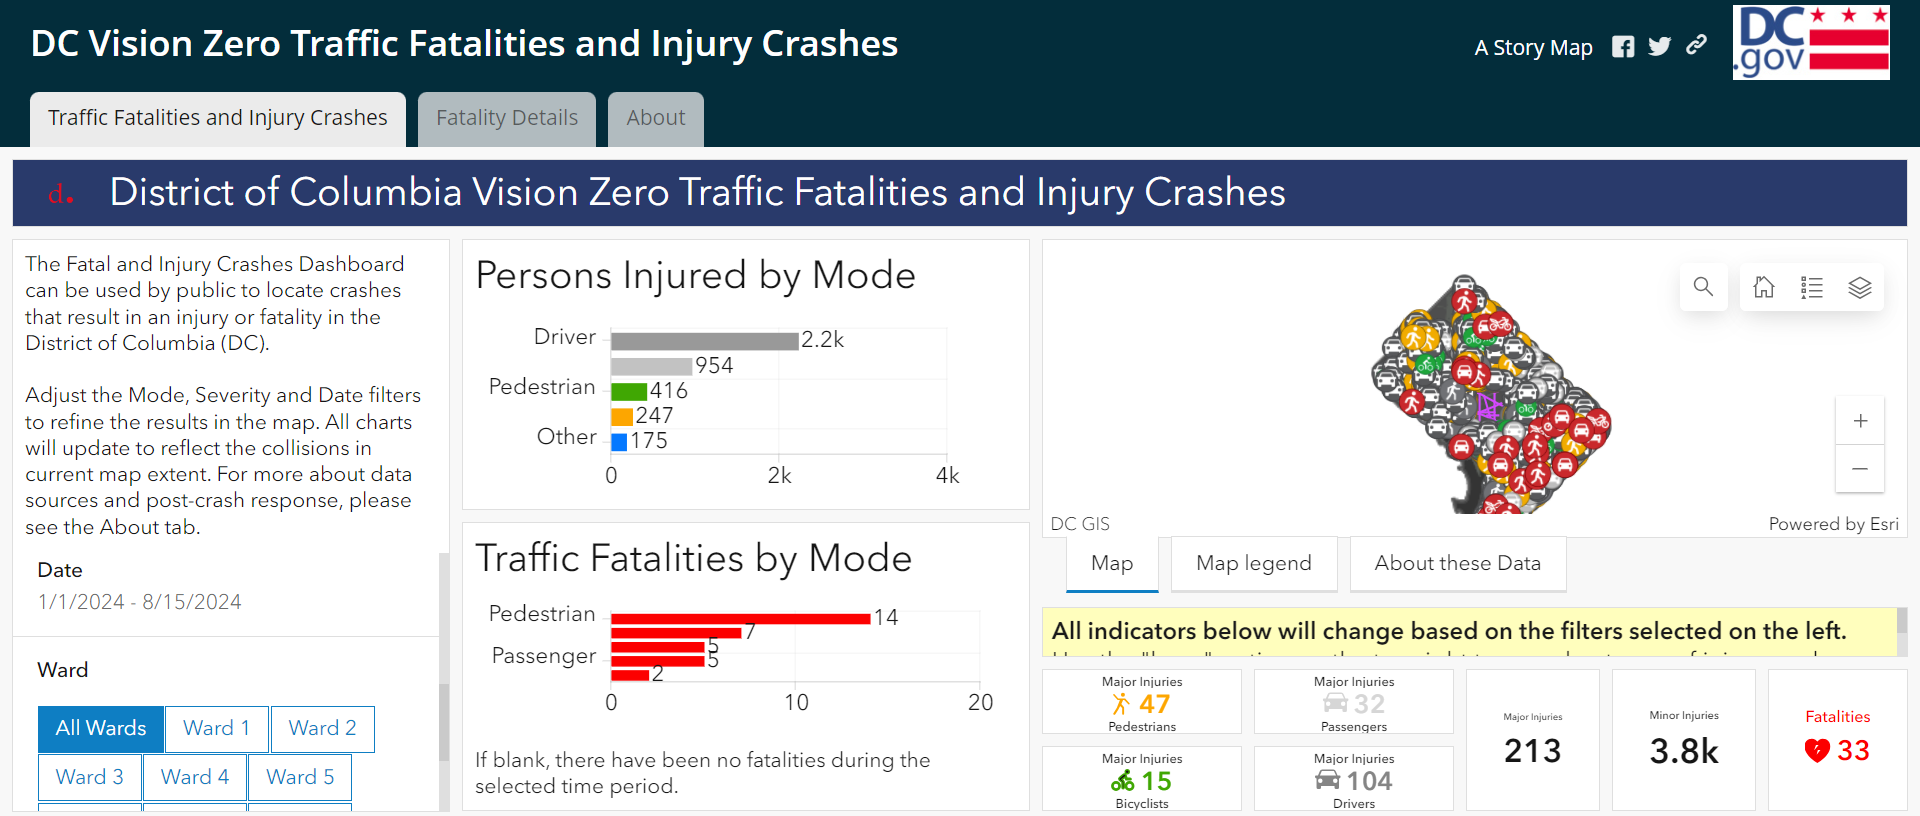
Users can also filter the dashboard by ward, neighborhood and date range.
“We have found that it is always useful and helpful to be transparent,” Singh said. “We want to make sure that the public is seeing the same data we are.”
Within a week of a fatal crash, Willson’s team at Vision Zero, the police department and DDOT meet to assess what can be done in the short term, he said. Then, they post a memo online reflecting what was discussed.
Willson noted the police department already reported traffic fatalities to the public but said that there was a need for a more robust tool to track crashes over time that’s more user-friendly.
Other dashboards track roadwork, project status
The crash dashboard isn’t the only tool related to traffic safety in DC.
“What is Happening Near Me?” houses more dashboards, also built using Esri. One is the Annual Safety Improvement Program tracker, which displays different projects related to roads and their status, divided by year.
The Safety Intervention Dashboard tracks and shows completed projects related to roads and intersections, like installing traffic cameras or implementing leading pedestrian intervals.
When pedestrians are given a head start to cross the street before cars in the parallel direction are given the green light. According to the dashboard, this data was last updated in February.
In all of these tools, the team at Vision Zero is focused on tracking activity on DC’s roads where repeated injuries or fatalities occur, including on Georgia Avenue in Northwest and Southern Avenue in Southeast, Willson and Singh noted.
Despite the current numbers, which Willson called a “worrisome trend,” they are both optimistic that tracking the data and looping in the public will make a difference.
“Sometimes we are not communicating fully the extent of work that we are doing,” Singh said. “These dashboards are really meant to showcase just the volume and quality of engineering work that we are doing in the district.”


