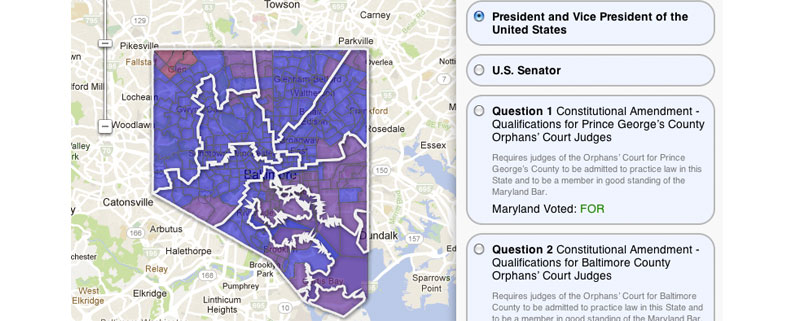
How did Baltimore city vote on Question 6, the referendum on the Civil Marriage Protection Act that would allow gay couples to obtain civil marriage licenses?
There’s a map for that.
Chris Whong, the 31-year-old owner of Charm City Networks, produced the “Baltimore Votes” map at the request of Maryland state senator Bill Ferguson. The map itself is a Fusion Tables-based web map, Whong said in an e-mail.
View the Baltimore Votes map.
It’s not the only map Whong, presently an urban planning student at New York Universty, has produced. His other maps have used GIS mapping to plot students’ pass rates on the Maryland School Assessment Exam and the tweets Baltimoreans send, and he has made a 3D view of city residents’ 311 calls.
“I’ve mapped Baltimore at length … but precinct-level election data was especially interesting,” said Whong.
As for what this type of mapping can do for politics?
“I think data at this resolution allows politicians to better understand their constituencies,” Whong said. “Senator Ferguson has a better reading of the 46th district’s pulse with data like this at his disposal.
Join the conversation!
Find news, events, jobs and people who share your interests on Technical.ly's open community Slack

This Black gaming advocate has a mission to transform education through esports
'Be bold': This digital innovation and business strategist urges fellow women leaders to be their authentic selves
Baltimore Power Moves: Open Works and Coppin State partner for a new makerspace, degree and tech transfer program