A story is more powerful with data.
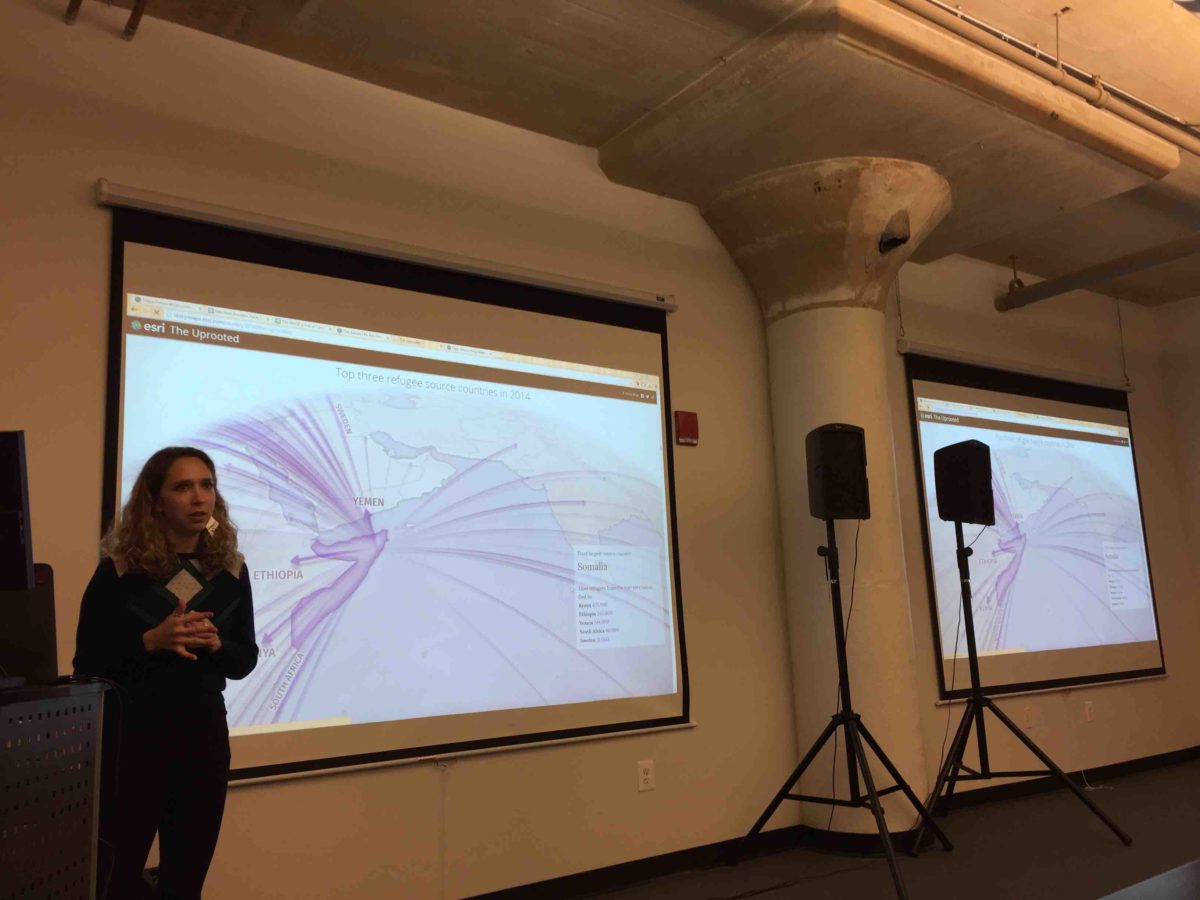
That was the gist of “Building Stories with Maps,” a Philly Tech Week 2016 presented by Comcast presentation from Esri at Azavea’s new headquarters. At the event, Esri solution engineer Lauri Dafner taught the crowd how to make their own story maps using Esri’s user-friendly Story Maps website.
What are story maps?
Dafner defined story maps as “simple web apps that combine interactive maps, multimedia content and user experiences to tell stories about the world.” These maps can take on a variety of forms and can be used as a reporting tool, a way to solve problems and a way to share information differently. Most recently, we’ve seen the Philadelphia Police Department use a story map to provide context for its stop-and-frisk data.
“It’s really important to have location as part of the story,” said Dafner. “When you can incorporate location into telling a story and allow people to explore it through interactive maps, you really give a total overall view into what’s happening somewhere.”
By putting a story map out to the public, it holds the story more accountable than if it were simply written, said Labaron A. Palmer, a Geography and Urban Studies Ph.D. student at Temple University who uses story maps in his Digital Mapping lab.
“With story maps, people get to come to their own conclusions,” he said. “They interpret story maps however they can with their unique life experiences. The map is the spatial layer and the story is underneath.”

Here are three examples Dafner showed:
- The Philadelphia Horticultural Society created a story map in place of its annual report. This story map includes text, maps and video, which beats a lengthy PDF any day.
- Zoo Babies, a story map created by The National Zoo, shows where baby animals are in the zoo and where they would live in the wild. It’s pretty adorable.
- Story maps can also put the spotlight on crucial human rights issues, such as the Syrian refugee crisis, in The Uprooted. This interactive story map shows the journey of refugees through video, interactive maps, text and graphics. The powerful video on the homepage of people walking with their families and all of their belongings tells a powerful story all on it’s own.
Want to explore telling a story with a story map? Head on over to Esri’s Story Maps site. You don’t even have to know how to code.
Try it


