Civic News

Analyze crash trends with VDOT’s data visualization tool

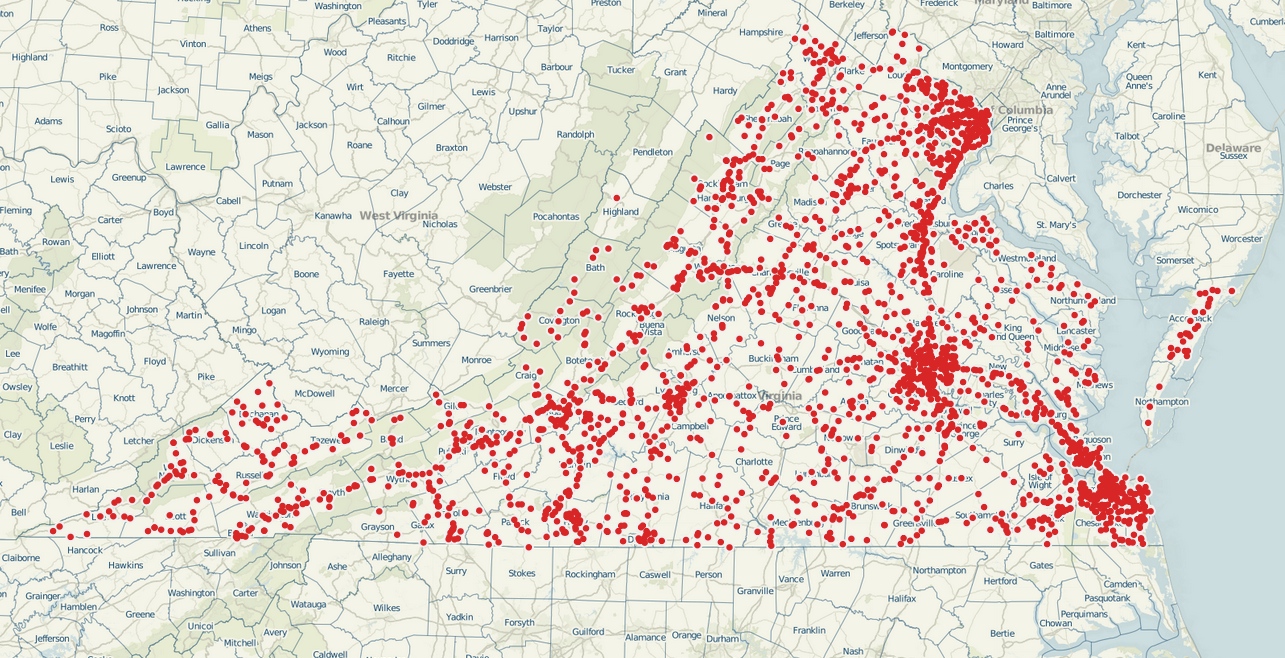
You can slice and dice data from the Virginia Department of Transportation (using data viz software Tableau) to see crashes and accidents across the commonwealth.

A map of fatal crashes in Virginia since 2008. (Screenshot via Tableau)

The Virginia Department of Transportation has shifted gears in its approach to open data.
Since 2013, the agency has used data visualization software Tableau to present its data on accidents and crashes in a more intuitive and useful way.
Try it
This can help citizens pull the lever of change if the numbers prove an intersection or road is dangerous.
“You can say I want to see I-95 in Fairfax County and only see fatalities,” said Keith Donley, the enterprise data manager at VDOT.
This can fuel “conversations about where the most dangerous roads are.”

Pedestrian fatalities in and around Arlington since 2008.

Pedestrian fatalities in and around Arlington since 2008. (Map via Tableau)


With the use of Tableau, VDOT is also developing an internalized know-how for data visualization, allowing the agency itself to make better use of the tools. “Any time you can introduce a tool into the administration,” said Donley, “it’s a home run.”
In fact, VDOT has become so proficient in data visualization that it won the state’s Datathon competition in September. The contest pits Virginia’s government agencies against each other in a bid to create the best government app in 48 hours. VDOT’s team of six, led by Donley, created interactive dashboards to connect job seekers and employers in the tech industry.
So next time a hazardous crossing comes to your attention, verify for yourself how dangerous it is by fiddling with the VDOT data.

Before you go...

Please consider supporting Technical.ly to keep our independent journalism strong. Unlike most business-focused media outlets, we don’t have a paywall. Instead, we count on your personal and organizational support.

3 ways to support our work:
  • Contribute to the Journalism Fund. Charitable giving ensures our information remains free and accessible for residents to discover workforce programs and entrepreneurship pathways. This includes philanthropic grants and individual tax-deductible donations from readers like you.
  • Use our Preferred Partners. Our directory of vetted providers offers high-quality recommendations for services our readers need, and each referral supports our journalism.
  • Use our services. If you need entrepreneurs and tech leaders to buy your services, are seeking technologists to hire or want more professionals to know about your ecosystem, Technical.ly has the biggest and most engaged audience in the mid-Atlantic. We help companies tell their stories and answer big questions to meet and serve our community.
The journalism fund Preferred partners Our services
Engagement

Join our growing Slack community

Join 5,000 tech professionals and entrepreneurs in our community Slack today!

Trending

Why are there so few tech apprenticeships?

Do zero-waste takeout containers work? We tried a new DC service to find out

DC houses many industries — and a ton of tech jobs

This Week in Jobs: Travel far in your career with these 26 open tech roles

Technically Media