Earlier this month, Philadelphia surpassed 400 murders within the city, with 322 lives being lost to gun violence. It’s on track to be the deadliest year since 2007.
News of the killing of West Philadelphia resident Walter Wallace Jr. by Philadelphia police Monday night continues to draw attention to gun violence in the city, as his death was the latest in a disturbing number of Black lives claimed by law enforcement.
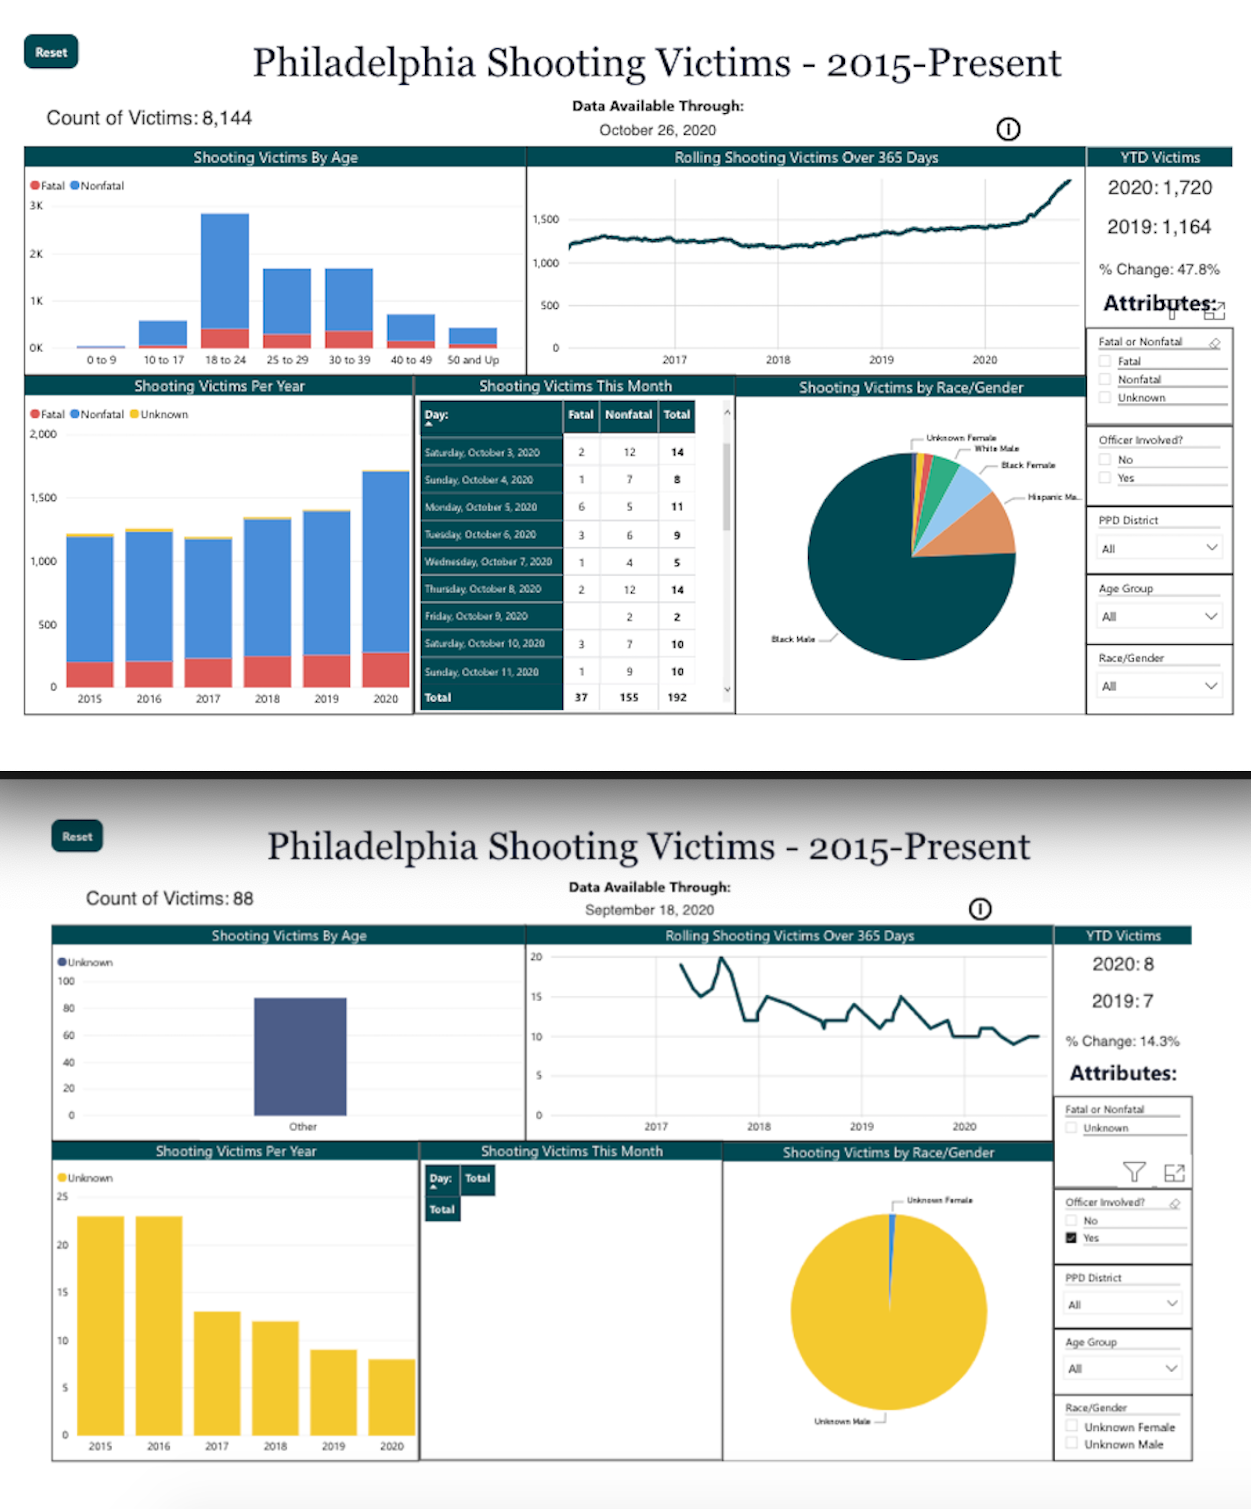
Many news outlets reported these statistics, and on Wallace’s death, as the city tracks about 40% higher than last year at this time. And tech solutions like the Office of the Controller’s mapping tool and the Initiative for Better Gun Violence Reporting’s Philadelphia Shooting Victims Dashboard both offer data visualization to see trends and keep track.
But the live data we rely on is flawed. So is news media coverage, says Jim MacMillan, director of Initiative for Better Gun Violence Reporting: More than half of all shooting victims in Philadelphia were not reported in the news, and when they are, it’s often centered on deaths, multiple shootings, women and children, he said, citing findings of a recent study by Preventative Medicine.
https://twitter.com/jimmacmillan/status/1314552242532429825?s=21
The Philadelphia Shooting Victims Dashboard project uses data from Open Data Philly. It is interactive, can be embedded into other sites and takes a wide look at gun violence in Philadelphia starting in 2015 through present day. Users can look at specific data points, like age of gunshot victims over time, or number of shootings that turned fatal. They can also opt to look at only shooting involving police officers, or shootings that happened indoors.
https://twitter.com/pcgvr/status/1321435299910746112
The data about shootings is public information and is updated by the Philadelphia Police Department. But it’s not updated every day, MacMillan said. The City has a large capacity, sure, but data updates happen on a random schedule, and that means news outlets could be unintentionally reporting incorrect numbers. A streamlined fix would be to update the data set around the same time every day.
“If we care about who’s dying, the least we could do is count them all,” MacMillan said.

Like all data sets, the shootings data has shortcomings. For example, when looking at all shooting victims for the last five years, you can see trends in age, shootings over time, and race and gender.
But when looking at officer-involved shootings, far less information is available. In the last few years, officer-involved shootings have decreased, but police didn’t submit information about age or race. So far in 2020, nine people have been shot by police, and Wallace is the first to be killed. But he’s not reflected in the data set as of Wednesday afternoon.
The set can’t tell us as much about what happened and who was involved. And that’s the real point here. It can give us some context, but it doesn’t represent what we really know and still need to learn about this public health crisis.
“We’re remembering that every data point is a person,” MacMillan said.
https://twitter.com/pcgvr/status/1321051868492083203


