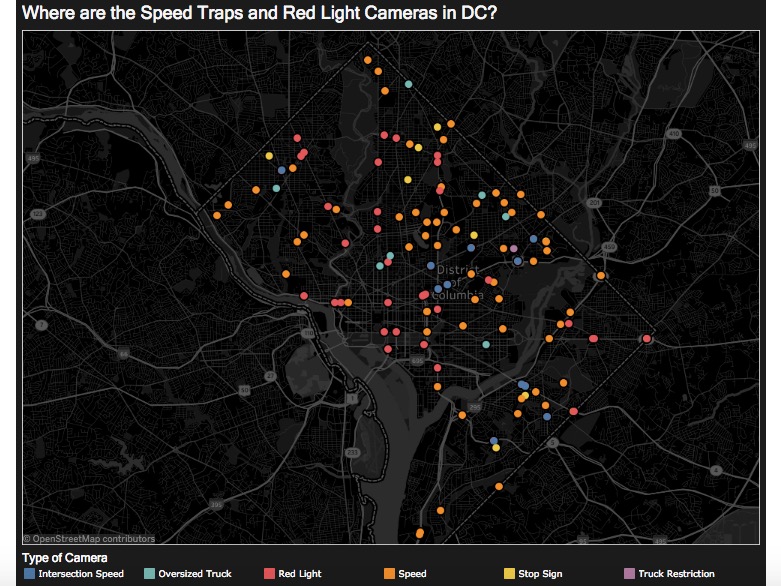
D.C.’s busy roads are full of speed cameras and red light cameras and even stop sign cameras. But where, exactly, are they?
A new data visualization from the site Overflow Data uses city open data to show the precise location and variety of the District’s various speed traps.
And, well, here’s what that looks like:

As a Reddit user noted with some snark: “assume all of DC proper is one big speed trap.”
Users can play around with the map to see just red light cameras, for example.
Overflow Data doesn’t appear to do many D.C.-focused visualizations, though the site has work showing everything from America’s unemployment rate to education level to voter registration statistics.
Its founder, Chase Sawyer, says he started publishing data visualizations about two years ago. He was getting his master of public administration at Arizona State, and “in my first class at ASU, I was required to read a book, Damned Lies and Statistics, by Joel Best,” Sawyer wrote to Technical.ly. “It is an extremely interesting book about how people misunderstand statistics or use them in ways that aren’t useful. After reading that book and learning more about how to do data analysis at ASU I started blogging about statistics I was interested in or that were in the news.”
At first, the blog heavily featured narrative surrounding the data, but Sawyer quickly got tired of that. “Eventually I found a subreddit, r/dataisbeautiful with lots of great examples of how people go about creating data visualizations,” he wrote. “I began to pivot my website away from the usual blog narrative and now instead focus on creating data visualization tools that people can use to find stories for themselves.”
And that’s what Overflow Data features today. Sawyer, who is now based in the DMV area, said he mostly uses U.S. Census Bureau data, hence the focus on national-level questions but has started getting more into city open data with time.


