It’s that time of year when the weather warms up, people spend more time outside — and the number of tick bites swells.
Thanks to the Pennsylvania Department of Health’s new tick dashboard, residents can jump into outdoor activities armed with resources to help navigate the seasonal spike of these bloodsucking arachnids.
“This is an effort to make both the public and health care providers a little bit more aware of tickborne diseases,” Leah Lind, the department’s Lyme and tickborne diseases coordinator, told Technical.ly.
Launched in time for National Lyme Disease Awareness Month, the dashboard features data on tickborne disease activity in the state, most notably Lyme disease cases, as well as information on preventing tick bites, removing ticks safely and other educational resources.
Collating all the data means government offices, health care providers and the general public can spot trends.
That’s important because Pennsylvania ranked ninth in the U.S. for Lyme disease cases reported by population, according to a DOH news release.
Lyme disease reports tracking close to 10-year high
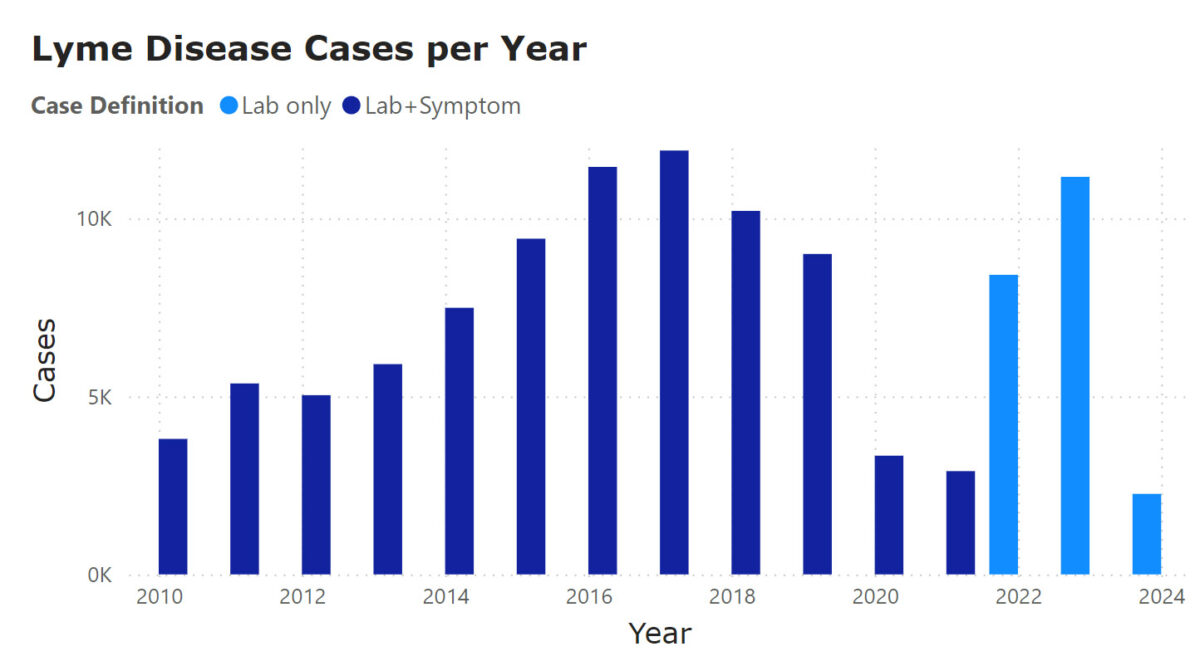
If you look at the dashboard data, don’t let the jump in Lyme disease from 2021 to 2022 scare you. It’s likely due to a lack of reporting that happened during the pandemic in 2020, Lind said.
The 10-year high for Lyme disease in Pennsylvania was in 2017, when a total of 11,903 cases were reported.
At that time, the DOH adhered to the CDC case definition, which included reporting a combination of clinical and lab findings. However, in 2022, “high incidence states” like Pennsylvania adopted a case definition that collects data from lab reports alone.
Even with the new definition and reporting, last year’s Lyme disease cases came close to the 2017 high, with 11,164 cases reported. So far, 2024 has shown similar month-over-month reports of Lyme, but it’s too soon to say how the year will shake out.
You may also notice a rise in bacterial infection anaplasmosis that Lind says more accurately reflects a pattern in tick-related disease, but Lyme is still by far the largest tick-related threat to outdoor enthusiasts.
DOH aimed to get the dashboard ready before the summer spike in bites, Lind said. The health agency wants the data to be easily accessible for health care providers for easier diagnosis of tickborne diseases.
A champion behind the effort to build the dashboard, Lind had a good rubric for it with the Respiratory Virus Dashboard launched by her colleagues last October.
“I came up with the initial idea having seen what respiratory viruses did with their dashboard,” Lind said. The CDC also has a Lyme disease dashboard, she added, and she consulted with a couple of other states, New Jersey and Vermont, that already had set up visualizations for ticks.
DOH employees built the tick dashboard using a data visualization tool by Microsoft, Power BI. Lind said the software didn’t require a lot of programming knowledge to get it up and running.
Cities aren’t safe from ticks, so take precautions
One important thing to remember, Lind said, is that while ticks are often thought to be more common in heavily wooded areas, they are found in urban areas, too.
“The deer ticks that carry Lyme disease, anaplasmosis, are found in every single county in Pennsylvania,” she said.
Additionally, while the big spike in tick bites happens in the summer months, Lind said Pennsylvanians should be vigilant year-round because ticks don’t necessarily die out in the winter.
The dashboard lists preventative measures residents can take. A good start is treating shoes, clothes and outdoor gear with permethrin and checking yourself, kids and pets for ticks when coming in from an outdoor venture, Lind said.
“We know how important it is to spend time outdoors for our health, our mental health, so we definitely don’t want it to discourage people from spending time outdoors,” Lind said. “Just be aware of the risk and take appropriate precautions.”


