
Incoming Temple University freshman Scott Blender is not spending his last summer before college like many other recent high school graduates.
He could have spent most of his days binging Netflix, hanging with friends or soaking in the summer weather, but the Penn Valley native has been spending the last few months thinking, learning about and working directly with the overwhelming amount of coronavirus data that comes out every single day.
Back in April, Blender and about 20 other young adults who knew each other virtually set out to form the Coronavirus Visualization Team (CVT). While many of them didn’t have money or supplies to donate to frontline workers fighting the virus, they could at least try to help people understand the severity of the pandemic, he said.
“There is this large-scale infodemic,” Blender told Technical.ly. “And we really noticed how data visualization could be used to tell the larger story.”
The goal of the organization, which has been granted 501(c) status, is to connect students to relevant academic research opportunities, bolster efforts of orgs fighting on the frontlines by forming partnerships with them, and spread awareness to the insights uncovered by its data visualizations and research.
Blender is the organization’s chief operating officer and executive director of its board of directors, and when he gets to Temple in the fall — the university has announced a “blended” schedule of virtual and in-person classes — he’ll be majoring in economics and data science.
Since CVT’s inception, it’s grown to include about 300 mostly college-age students around the world, Blender said. The team is made up of data scientists, researchers, developers and analysts who work with data sets involving a variety of facets of the pandemic — unemployment, socioeconomic data, comparing the pandemic to climate change effects and seeing where current case counts are rising.
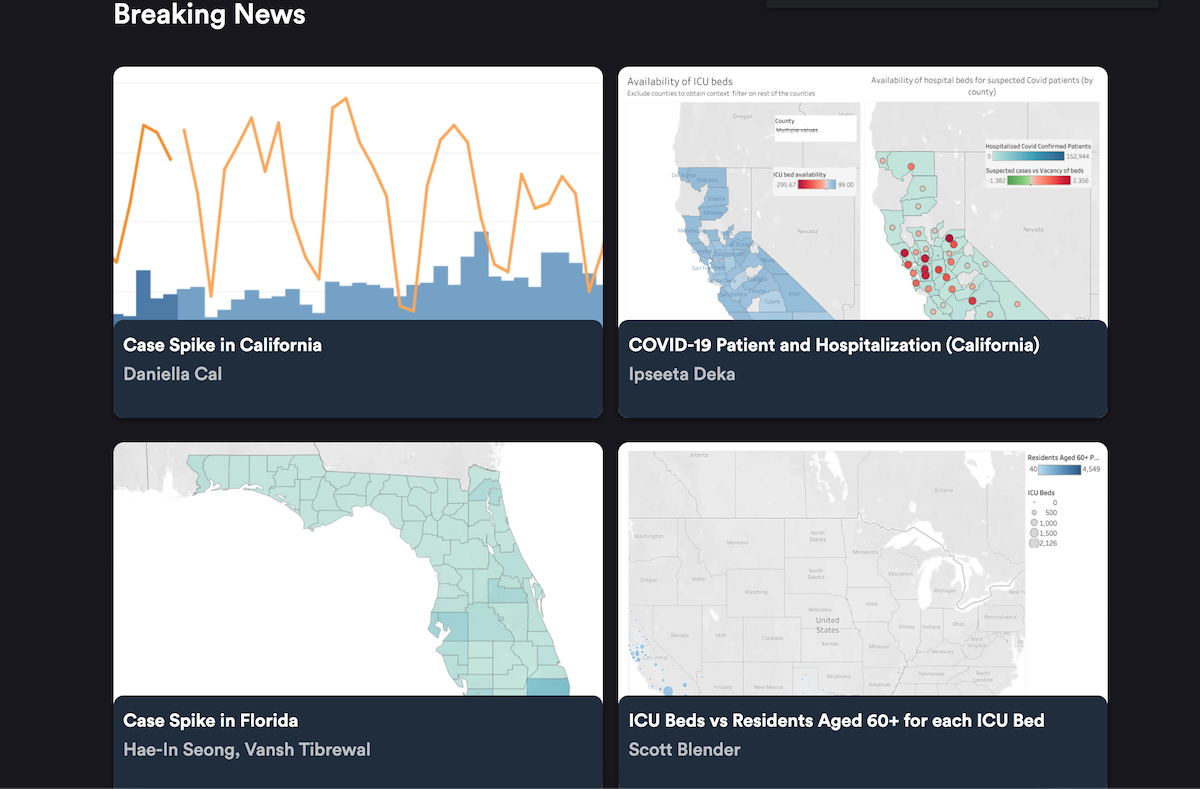
The volunteers are pulling data sets from multiple locations like Our World of Data and Johns Hopkins, Blender said. Then, they’re being visualized and made sharable in Tableau. Scroll to check one out:

var divElement = document.getElementById(‘viz1594833405283’); var vizElement = divElement.getElementsByTagName(‘object’)[0]; vizElement.style.width=’1016px’;vizElement.style.height=’991px’; var scriptElement = document.createElement(‘script’); scriptElement.src = ‘https://public.tableau.com/javascripts/api/viz_v1.js’; vizElement.parentNode.insertBefore(scriptElement, vizElement);
The team is growing, Blender said, and is accepting applications for others who want to get involved, create data visualizations or help on further projects, like informative programing, that the org is planning on starting. It currently offers a list of coronavirus and data viz resources on its site and folks can subscribe or donate to the project.
“We want to be a gateway for data journalists, and help them leverage the information we’ve gathered to tell those stories,” Blender said.
Join the conversation!
Find news, events, jobs and people who share your interests on Technical.ly's open community Slack

Philly daily roundup: Women's health startup wins pitch; $204M for internet access; 'GamingWalls' for sports venues

Philly daily roundup: East Market coworking; Temple's $2.5M engineering donation; WITS spring summit

Philly daily roundup: Jason Bannon leaves Ben Franklin; $26M for narcolepsy treatment; Philly Tech Calendar turns one
