The Baltimore Police Department has promised to increase patrols in response to a recent spate of street robberies, many in the North Baltimore neighborhoods of Roland Park, Hampden and Remington.
According to the Baltimore Sun, street robberies are up six percent this year, and the police “began taking note of these street robberies on Aug. 2, when a group of men stole a vehicle in Waverly, then joined up with another group and cruised around North Baltimore, confronting at least four people and stealing cellphones from runners.”
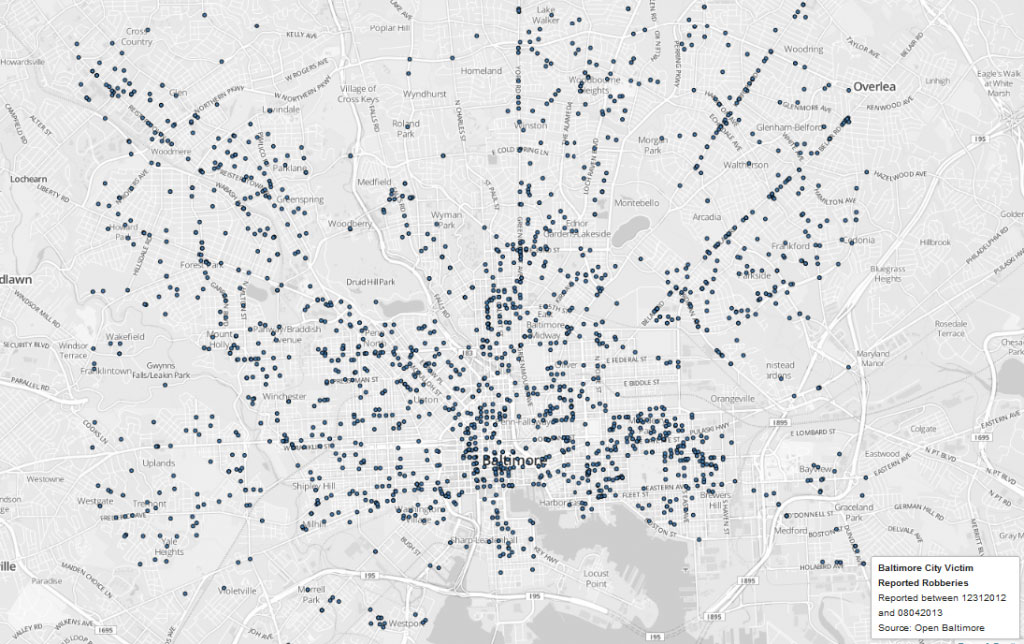
But mapping robbery data pulled from OpenBaltimore reveals a truism, one that could be readily applicable to other cities: most of the robberies in Baltimore city occur downtown where there’s plenty of foot traffic. The below two maps from Baltimore Innovation Week awards nominee, community organizer and crime-focused blogger Cham Green illustrate just that.
Here are reported robberies in the city from Dec. 31, 2012, through Aug. 4, 2013:

View the above map on Mapbox.
The second map depicts the “robbery concentration,” which was done “by dividing up the city into one-minute cells, then using a spreadsheet to calculate the number of robberies in each cell using OpenBaltimore data,” said Green via e-mail.
Granted there should be some clarity here: with greater density comes more people, and more crime follows. It’s one reason that crime rates are tricky measures that often follow per 100,000 person counts.

Join the conversation!
Find news, events, jobs and people who share your interests on Technical.ly's open community Slack

Baltimore daily roundup: Mayoral candidates talk tech and biz; a guide to greentech vocabulary; a Dutch delegation's visit

Baltimore daily roundup: Medtech made in Baltimore; Sen. Sanders visits Morgan State; Humane Ai review debate

Baltimore daily roundup: An HBCU innovation champion's journey; Sen. Sanders visits Morgan State; Humane Ai review debate
