What does a hectic cabbie’s day look like? What does an average fare look like? How often might he travel between Manhattan and Brooklyn?
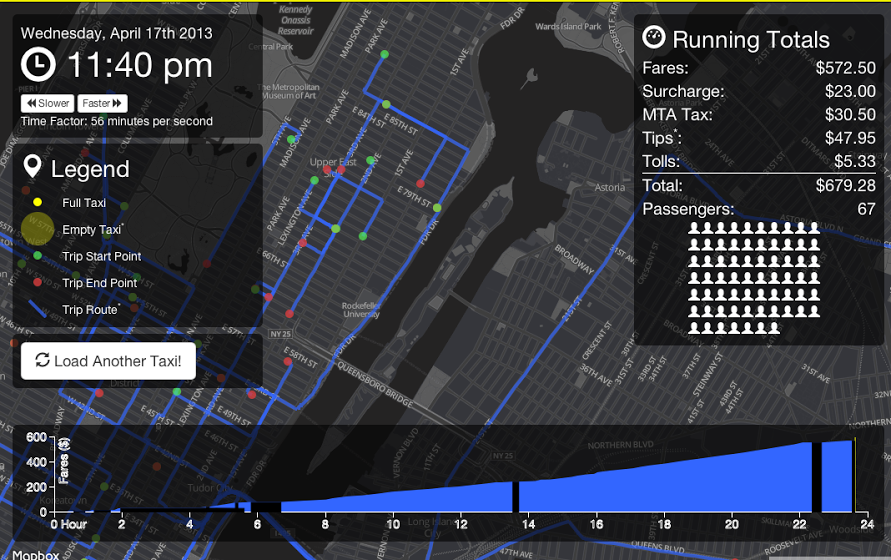
A new visualization by civic hacker and downtown Brooklyn resident Chris Whong gives users a glimpse into the daily journeys of New York City taxi drivers. NYC Taxis: A Day in the Life traces the route of random cabs as they travel across the boroughs, as well as how many passengers they carried and how much money they earned.
Use the visualizationThe tool visualizes a random cabbie trip from 2013 on a map of New York City, letting you follow its movement. It won’t help you hail a cab. Instead, it gives a different perspective on New York City transportation.
“Everyone knows about taxis but this gives them an interesting look behind the scenes,” said Whong, 33, who works at open data IT giant Socrata and is a co-organizer of BetaNYC, the city’s Code for America brigade. “There are taxis everywhere but only a few academic teams had access to [the data set].”
The data also gives a glimpse into the lives of cab drivers. The very existence of the data set shows that taxi drivers are also closely watched. Earlier this year, Whong filed a Freedom of Information Law request for the data from the Taxi and Limousine Commission — 18 gigabytes, which you can download here.
Whong built the tool using D3 and Leaflet for the front-end experience and Node.js, Express and sqlite on the back-end.
“In processing the data, I used some Node scripts to get Polylines for each trip segment from the Google Directions API,” he said.
Independent contractors operate taxi televisions, meters and GPS systems, which collect data on the whereabouts and business dealings of taxi drivers.
The visualization also shows that cab drivers work long shifts, crisscrossing the city from dawn until dusk. Whong also found gaps when cabs did not find rides, when it appears drivers change shifts in the middle of the afternoon.
In the early hours of the morning, after late-night revelers have gone home and before the earliest commuter is stirring, some cabs cruise the street for as long as several hours without finding a fare.
Whong said fellow Brooklyn residents won’t be surprised to hear that the visualization also shows that taxis rarely venture outside of Manhattan.
“Most all of the trips on the visualization do not go to the boroughs and you see those long rider-less trips back to Manhattan where they have the best chance of getting fares,” said Whong, who moved to Brooklyn from Manhattan himself in April.
The data set that is currently available ends before New York City implemented green borough taxis, so it does not show how Brooklyn’s taxi landscape has changed. Whong, however, is not convinced the green cabs have made taxis universally hail-able in the boroughs.
“People say now we have the borough taxis and this is great, but those taxis still hang around Williamsburg and downtown [Brooklyn]” he said. “Maybe we need borough — borough taxis to take you even further.”
Join the conversation!
Find news, events, jobs and people who share your interests on Technical.ly's open community Slack