
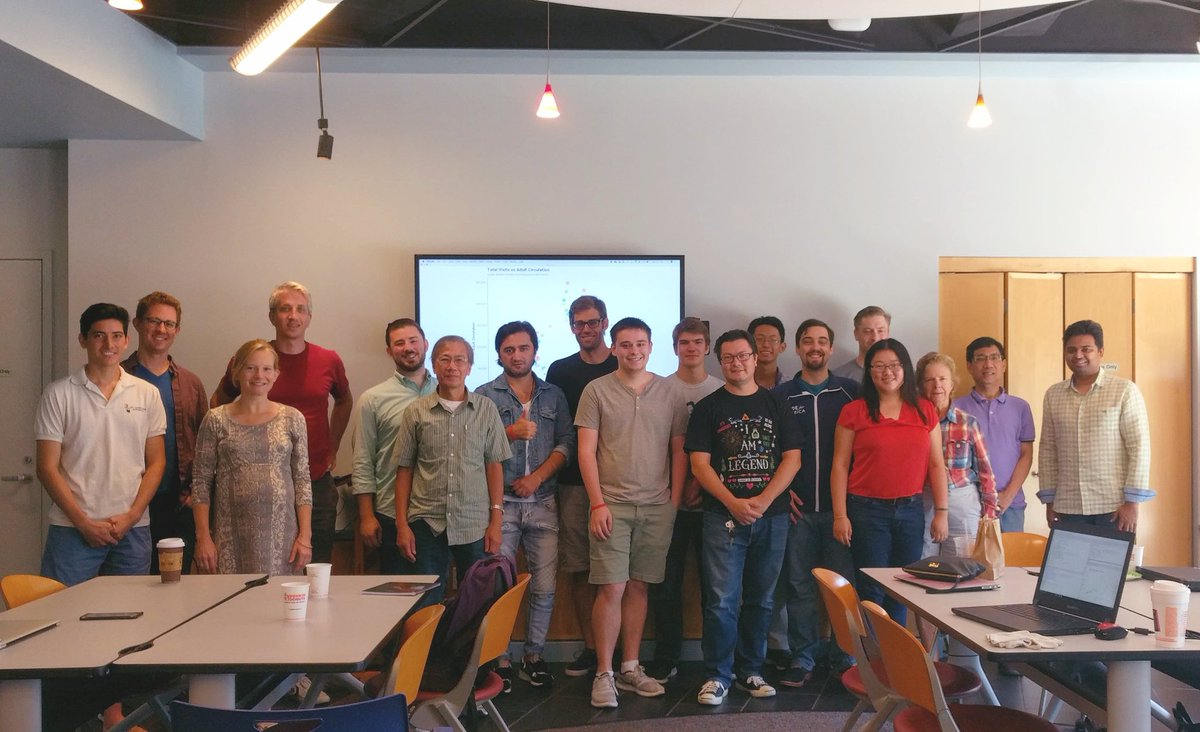
Open Data Delaware’s weekly Code & Coffee, held Saturday mornings at Brandywine Hundred Library, took on a special project for the Sept. 23 National Day of Civic Hacking (NDoCH): The group took the library’s own open data and used it to learn data visualization.
We had an awesome time Saturday learning how to visualize @DELibraries #OpenData! Thanks to everyone who came out for #NDoCH!! pic.twitter.com/MG1XueRjqp
— Open Data Delaware (@opendatade) September 25, 2017
Data visualization is, simply put, data that is made legible in visual formats. Charts, graphs and especially maps are crucial to civic tech, where raw data needs to be made accessible to the community.
Interested in learning how to do it? Ryan Harrington, Code & Coffee organizer, shared a detailed breakdown of what they learned Saturday on his blog.
Great to run this @opendatade workshop on #ggplot. Used some great @DELibraries data. Check out what we covered at https://t.co/MrHzJYsZWg https://t.co/IsHGSmn43i
— Ryan Harrington (@rharrington31) September 25, 2017
The next Code & Coffee is this Saturday from 10:00 a.m. to 12:00 p.m., at the regular spot. The free workshops are open to all skill levels — bring your own device and a breakfast item to share.
You can RSVP below.
https://www.meetup.com/Open-Data-Delaware/events/242754257/
Join the conversation!
Find news, events, jobs and people who share your interests on Technical.ly's open community Slack

Delaware daily roundup: Delmarva Power vendor stats; DelDOT's $15M federal grant; 50 best companies to work for
Delaware daily roundup: Over 4,000 Black-owned businesses uncovered; Dover makes rising cities list; a push for online sports betting
Delaware daily roundup: Ladybug Fest illuminates small biz; Hahnemann Hospital's biotech future; intl. politics and a Middletown project