This editorial article is a part of Design Month of Technical.ly's editorial calendar.
Programs like CitiStat and the CleanStat initiative are key contributors to the City of Baltimore winning the distinction as a leading local government using data from What Works Cities.
A national initiative of Bloomberg Philanthropies, What Works Cities recently named Baltimore to its 2020 honor roll, placing it as an up-and-coming leader among the top 30 cities evaluated for efforts to inform policy and educate the public in the last five years.
Inside city government, it’s data fellows like Sara Brumfield and a design philosophy oriented toward agencies that create the progress and change that eventually gets recognized by awards and certifications. Brumfield, who is in the Baltimore Office of Performance and Innovation’s (OPI) inaugural class of data fellows, designed a dashboard for internal use by the Department of Public Works that allows tracking of cleaning work orders in real time. Separately, the city has also developed a public-facing CleanStat dashboard through work that included the Baltimore Department of Public Works (DPW), CitiStat and the Department of Housing and Community Development.
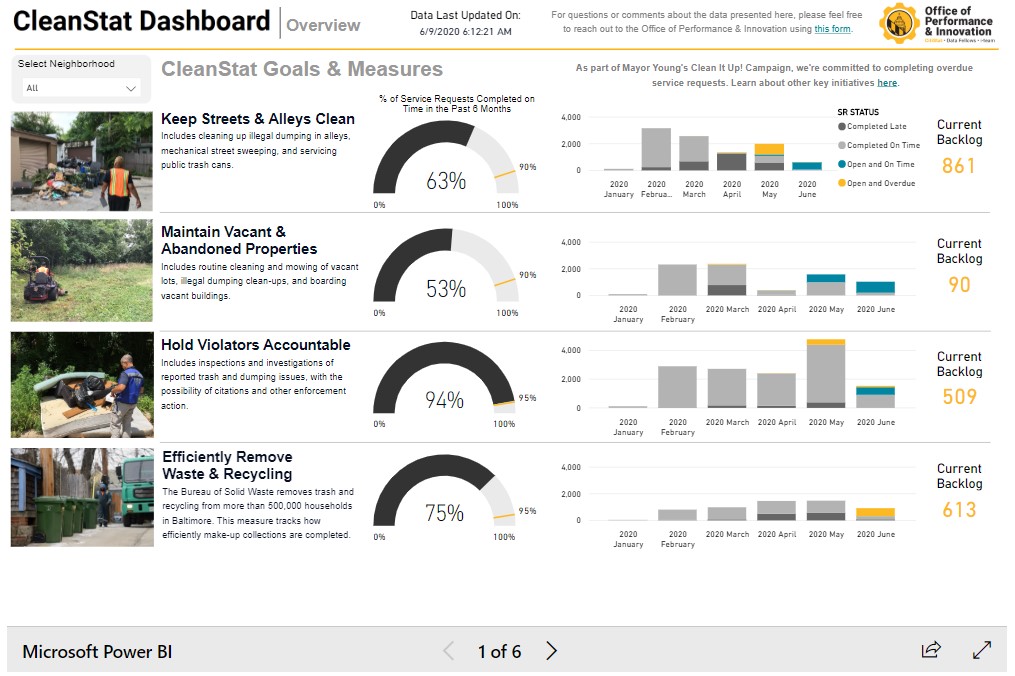
A screenshot of the public CleanStat dashboard. (via Baltimore city government)
The dashboard used internally was the result of an iterative design approach to data solutions. In practice, that meant Brumfield shadowing crews out working in the streets and administrators in the office. It also meant sitting in on meetings and asking the same questions to five different people five different times.
“I don’t want to build them a tool that they can’t use,” said Brumfield. “You really have to understand how people are going to use it and what access and usability means for them, and not what it means to me.”
The dashboard allows the sanitation department to reduce data reporting lag to senior leadership by three or four weeks. This data results in real-time operational changes, officials said, like deploying teams in clusters and shifting a quadrant system of managing work crews to a more decentralized operation.
“We were dispatching crews in the dark,” said John Chalmers, head of the DPW’s Bureau of Solid Waste. Before the dashboard and the data innovations brought by Brumfield and OPI every 311 request was handled in the order they were received with little regard with the amount of work.
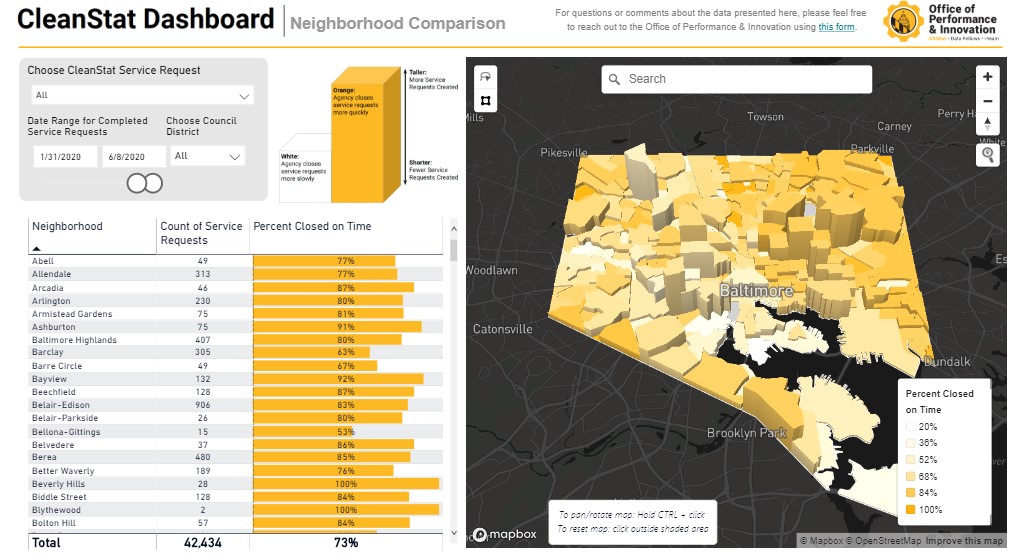
BaltOPI’s CleanStat dashboard (Courtesy photo)
And under the quadrant system, work crews were bound to a specific area of the city. If a work order needed a crew that used heavy machinery in quadrant 1 but that quadrant’s heavy lifters were out or otherwise occupied, quadrant 1 couldn’t take a have machinery crew from quadrant 3 to fill that need. Each quadrant had their equally allotted resources, not considering that each area had unequal amount of needs. It was a perfect example of equality not necessarily translating to equity.
“[The data] clearly showed that, if you stick with the quadrant system, not only will your backlog continue to grow, you wouldn’t be in a position to provide services across the city in an equitable manner,” said Chalmers. “And, of course, we want to provide services across the city equitably to all of our customers.”
The previous lack of data and efficiency led to 16,000 overdue cleaning orders. Before the COVID-19 pandemic presented a new set of operational hurdles, the number of orders was reduced to only a few hundred with the commitment to data-driven decision making, according to data from the city.
“Instead of having to sift through reports or Excel sheets, they’re able to quickly find a number, a percentage or an answer on the dashboard,” said Brumfield.
She was adamant about giving all credit to the Bureau of Solid Waste because although as the data fellow she makes the tool, it’s the department itself that takes something like the dashboard and runs with it.
“The numbers tell the story,” said Chalmers, explaining that the beauty of the dashboard and the data fellows’ work is how, as a department head, he can illustrate what resources he needs to make goals a reality. “because I can clearly show that they’ve done their best, they’ve met their goals but it will take additional resources to get to the finish line.”
Donte Kirby is a 2020-2022 corps member for Report for America, an initiative of The Groundtruth Project that pairs young journalists with local newsrooms. This position is supported by the Robert W. Deutsch Foundation.Join the conversation!
Find news, events, jobs and people who share your interests on Technical.ly's open community Slack

Baltimore daily roundup: Medtech made in Baltimore; Sen. Sanders visits Morgan State; Humane Ai review debate

Baltimore daily roundup: The city's new esports lab; a conference in Wilmington; GBC reports $4B of economic activity

Baltimore daily roundup: Find your next coworking space; sea turtle legislation; Dali raided and sued