
Thanks to the wonders of social media and Reddit, a map that visualizes Baltimore City property tax data is getting a second round of sharing this week.
Ryan J. Smith created the map, which uses data from OpenBaltimore as its source, at the 2013 Hack for Change Baltimore hackathon. The map was initially at BmoreMapped.com, but the version that’s circulating today is at a new site. BmoreMapped should be back up within a couple days, Smith said.
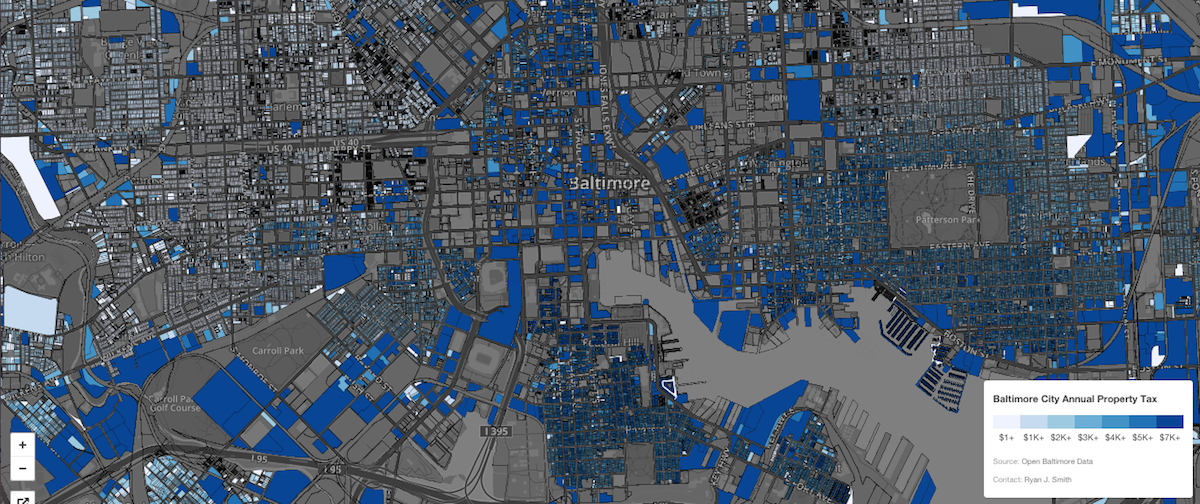
Since it’s searchable and cuts across a wide segment of the population, it’s easy to see why there’s a lot of interest here. As one Redditor pointed out, the choice of blue color is also fitting for how property taxes make most of us feel.
With the renewed interest in the project, we thought we’d provide a little context on how Smith made the map.
See the map
Smith used property tax and address values stored in a table available at OpenBaltimore, as well as a table with geometry for each address.
“I used QGIS to handle the table join and initial visualization (colored polygons). This creates essentially a vector graphic that is georeferenced,” he said. “Then, using Mapbox, I layered this file with an OpenStreetMap view of Baltimore.”
On the map, darker colors indicate higher property tax values.
Before the hackathon, Smith said he had never worked with data from Baltimore’s portal before. He called the experience “great.”
“I was surprised at how easy it was to download all the relevant tables I needed. It really only took me an hour or two to download the datasets I needed and merge them,” he said via email. “Trying to use the site’s built-in queries and visualizations was a little slow and frustrating at the time, but being able to download a local copy of the data generally fixes that problem.”
Smith said he hopes the city continues to open up its data as much as possible. (New city CTO Jerome Mullen appears to share that opinion.) Smith initially wanted to include an additional layer on the map that showed property taxes actually paid, and a map that showed historic changes to property values. But at the time, that data wasn’t available.
“It could be accessed on a property-by-property basis through individual queries, but you were out of luck if you wanted to get this information for every property in the city,” he said. “As far as I know, wholesale access to assessment history data (say through SDAT) or property tax payment history (through the city’s page) is only achievable through screen scraping, which is against the terms of service of both sites.”
Hear that, open data advocates?
Join the conversation!
Find news, events, jobs and people who share your interests on Technical.ly's open community Slack

Baltimore daily roundup: Medtech made in Baltimore; Sen. Sanders visits Morgan State; Humane Ai review debate

Baltimore daily roundup: An HBCU innovation champion's journey; Sen. Sanders visits Morgan State; Humane Ai review debate

Baltimore daily roundup: The city's new esports lab; a conference in Wilmington; GBC reports $4B of economic activity