For the last two years, the City has had a mission to understand how its residents use open data.
It started with a survey in early 2020, with the Office of Innovation and Technology asking residents about its 250 datasets on OpenDataPhilly.org the following: “What’s successful, difficult or lacking when it comes to data sharing in Philly?” Various City departments collaborate with OIT to release public data sets, and residents can find information on things like land use, building footprints or election results.
Of the hundreds of residents who responded — including those who hold positions in the nonprofit, business, academic research, community advocacy, journalism, education, urban planning and data spaces, as well as from people who are homeowners and renters — 90% said that open data is “important” to their work, and 92% thought that the office’s data visualizations are “helpful,” the office said last summer.
Now, OIT has released a new dashboard showing where the data is being accessed across the world. It also shows datasets that have recently been published and those that are a work in progress. Users can also fund overall performance metrics of the City’s Open Data Program.
“The goal of this dashboard is to show the importance of open data and to be transparent with the public about how we’re managing the work of publishing open data,” Mark Wheeler, the city’s chief information officer, said.
📢What’s new in @PhiladelphiaGov's open data work? A brand new dashboard!
📊Our #CityGeo team made it easy for anyone to see who is using #OpenData, what datasets have been released, what’s in progress, and more.
Check out the Open Data Dashboard⬇️ https://t.co/9cg2T77D1o
— PHLInnovation (@PHLInnovation) November 16, 2021
The dashboard is interactive: It allows users to search and filter for information or specific datasets according to their main interests, and filter by release year or department. The dashboard also includes a set of FAQs to explain key terms and show that the map relies on Google analytics data from 2015 and on.
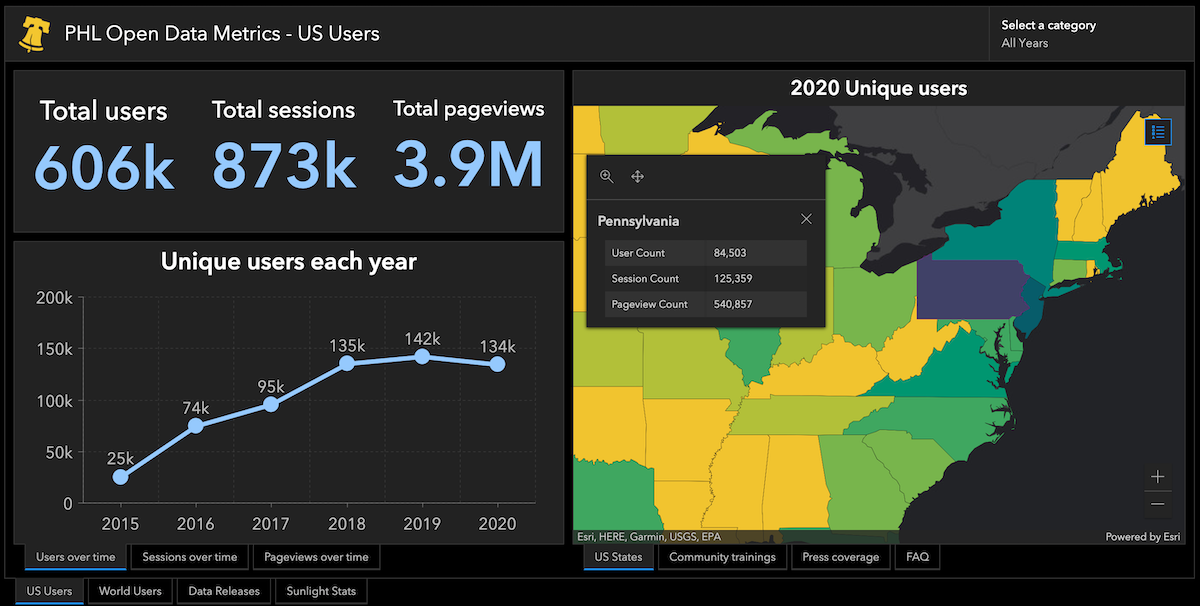
To date, since 2015, the open data program has been accessed by 606,000 users in the US, and by 661,000 users worldwide. The site has been accessed 4.2 million times since 2015, in nearly a million total sessions, and was used most often in 2019, with 2020 following closely behind, the dashboard shows.
The visualization shows that obviously, a lot of these users are from Pennsylvania, but neighboring states of New York, New Jersey and Maryland account for thousands of users and hundreds of thousands of page views. In fact, the global map shows users that there are only a handful of countries that haven’t accessed Philly’s open data in the last six years.
Kistine Carolan, the City’s open data project manager, is the creator of the dashboard. The results from the open data survey drove this internal work, which includes increasing data automation and building the department’s capacity to create even more data visualizations.
“The City’s 2020 PHL Open Data Survey showed that people use open data in meaningful ways and want to be able to access it easily,” Carolan said.
See the dashboardJoin the conversation!
Find news, events, jobs and people who share your interests on Technical.ly's open community Slack

Philly daily roundup: Earth Day glossary; Gen AI's energy cost; Biotech incubator in Horsham

Philly daily roundup: Women's health startup wins pitch; $204M for internet access; 'GamingWalls' for sports venues

Philly daily roundup: East Market coworking; Temple's $2.5M engineering donation; WITS spring summit