If you’re going to figure out how to solve problems, you have to know what the problems are. Enter Brooklyn mapping wizard Chris Whong.
You may know Whong from a litany of interesting maps. He’s the author of a beautiful property tax map, and also a historical scratch-away map of Brooklyn.
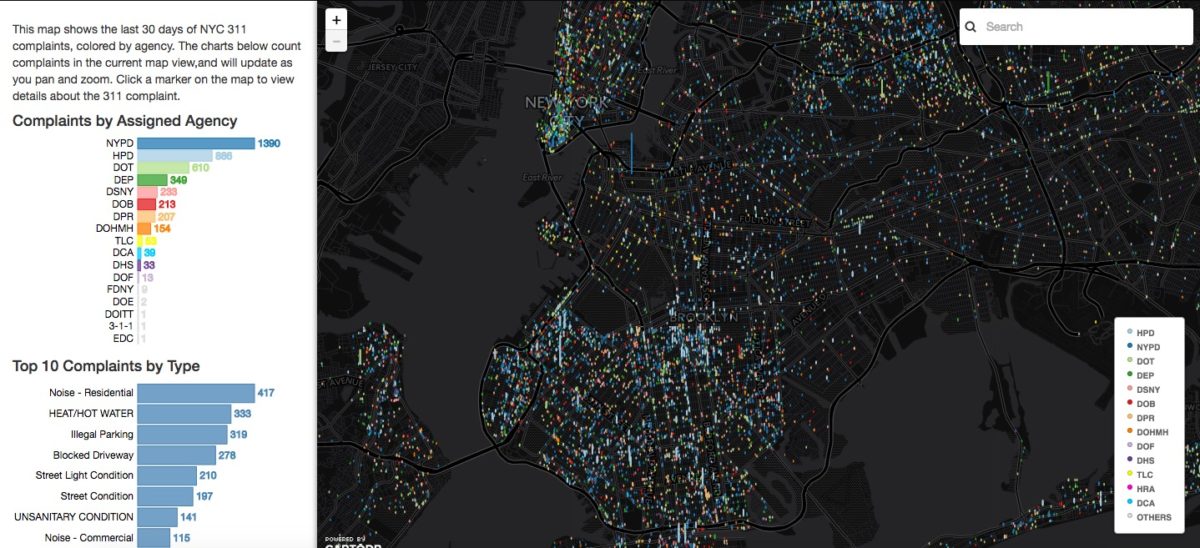
Now there’s 311Buddy. It displays all the 311 calls in the five boroughs in the last 30 days and stacks them up by type and address like so many little dots of frustration.
I made a thing. Last 30 days of @nyc311 #opendata for all of NYC. Check out your block. https://t.co/KvWTMollyY pic.twitter.com/GFFXhclJO1
— Chris Whong (@chris_whong) March 30, 2016
What does the map show? Well, there’s a lot of noise complaints in New York.
We find that South Brooklyn is quite a bit quieter than North Brooklyn, with only about half as many 311 calls. In Midwood, Bensonhurst, Gravesend, even Coney Island, either neighbors watch out for each other or people have just decided not to bring the law into their disputes.
We see that in Flatbush there are a ton of maintenance calls to the Department of Housing Preservation and Development. The calls are for lack of hot water, broken windows and doors, busted plumbing and the like. A lot of these come from the same addresses. HPD oversees affordable housing, and landlords are famously resistant to putting money into below-market apartments, so that could explain some of those calls.
In Park Slope and Prospect Heights we see a lot of Department of Transportation calls. Stoplights not working, potholes in the street, broken parking meters. Having a car in Brooklyn, it must be nice.
Moving further up, we find the address with by far the most complaints in the borough. It’s 56 Monument Walk and there are a mountain of noise complaints. 56 Monument Walk is one of the public housing towers in Dumbo by the Navy Yard. Many of the dozens and dozens of noise complaints are from the same night, Tuesday, May 3.
Moving further north, we find, as you might expect, the most Department of Environmental Protection calls are in Greenpoint. The charming residential neighborhood is also a bit of a post-industrial toxic wasteland, featuring the largest Superfund site in the city.
Whong doesn’t offer much in the way of analysis, and he usually doesn’t. Instead, these maps can be seen as openings to a discussion. They’re not going anywhere, and can be used by residents, representatives, advocates or nonprofits as a tool to show what the problems are. It’s up to them to offer solutions.
Join the conversation!
Find news, events, jobs and people who share your interests on Technical.ly's open community Slack